
State of Private Markets: Q2 2023
Authored by Kevin Dowd and Peter Walker
Summary
In the second quarter of 2023, venture funding on Carta saw a 26% increase, with startups raising over $15.4 billion. Trends are upward in areas like early-stage valuations and late-stage deal counts after recent declines. However, there’s still a long journey back to the peak levels of 2021, with year-over-year capital raised still down 58%.
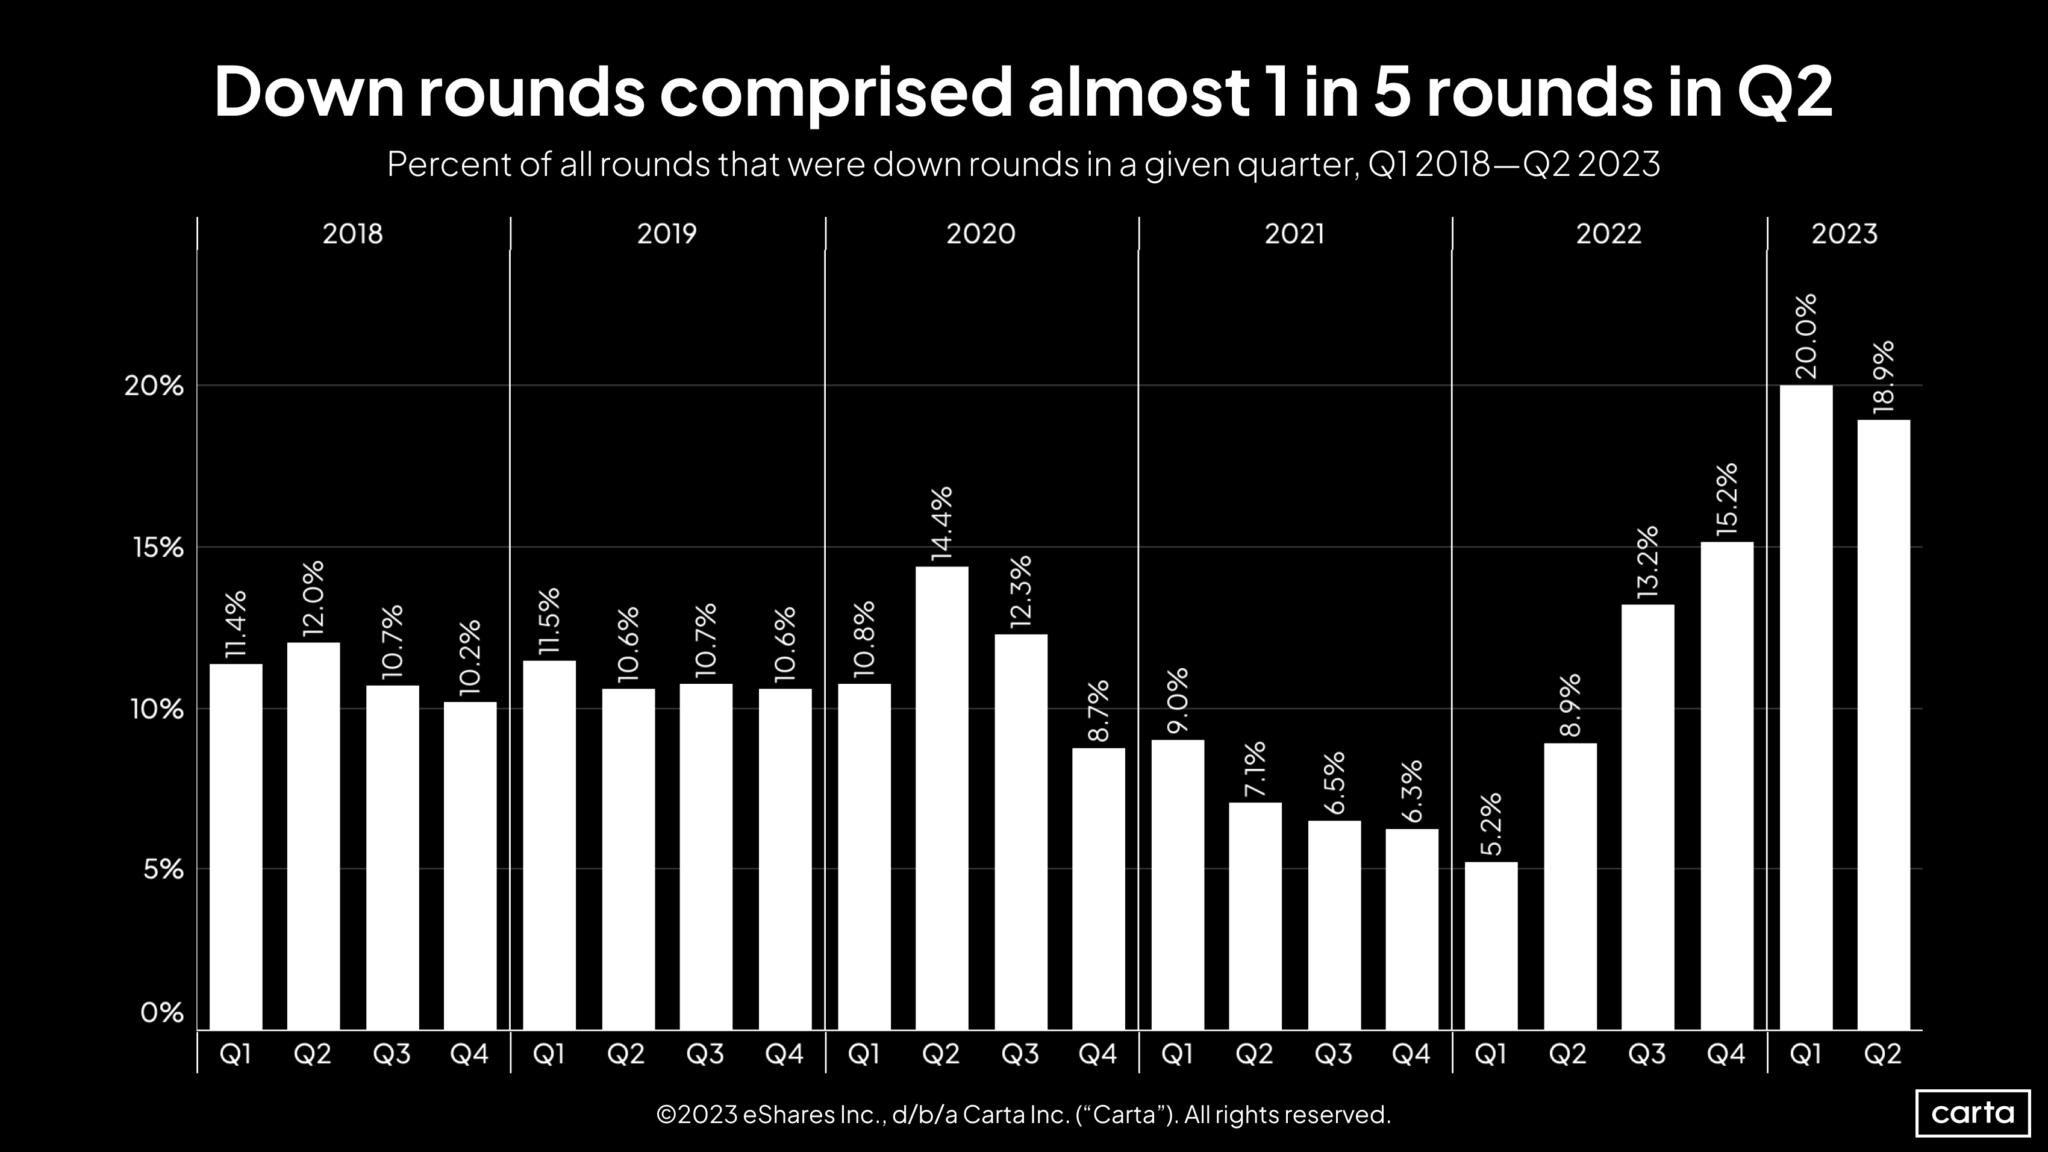
Almost 20% of all Q2 rounds were down rounds, the second-highest in five years. A full recovery to recent record-setting paces may take some time, but the first half of 2023 shows that the venture market has found a stable level.
Highlights from Q2
- Late-stage Deal Counts Increasing: Since Q3 2021, there has been a rise in the number of venture investments at every stage from Series B onward. Some stages had previously declined by at least 50%.
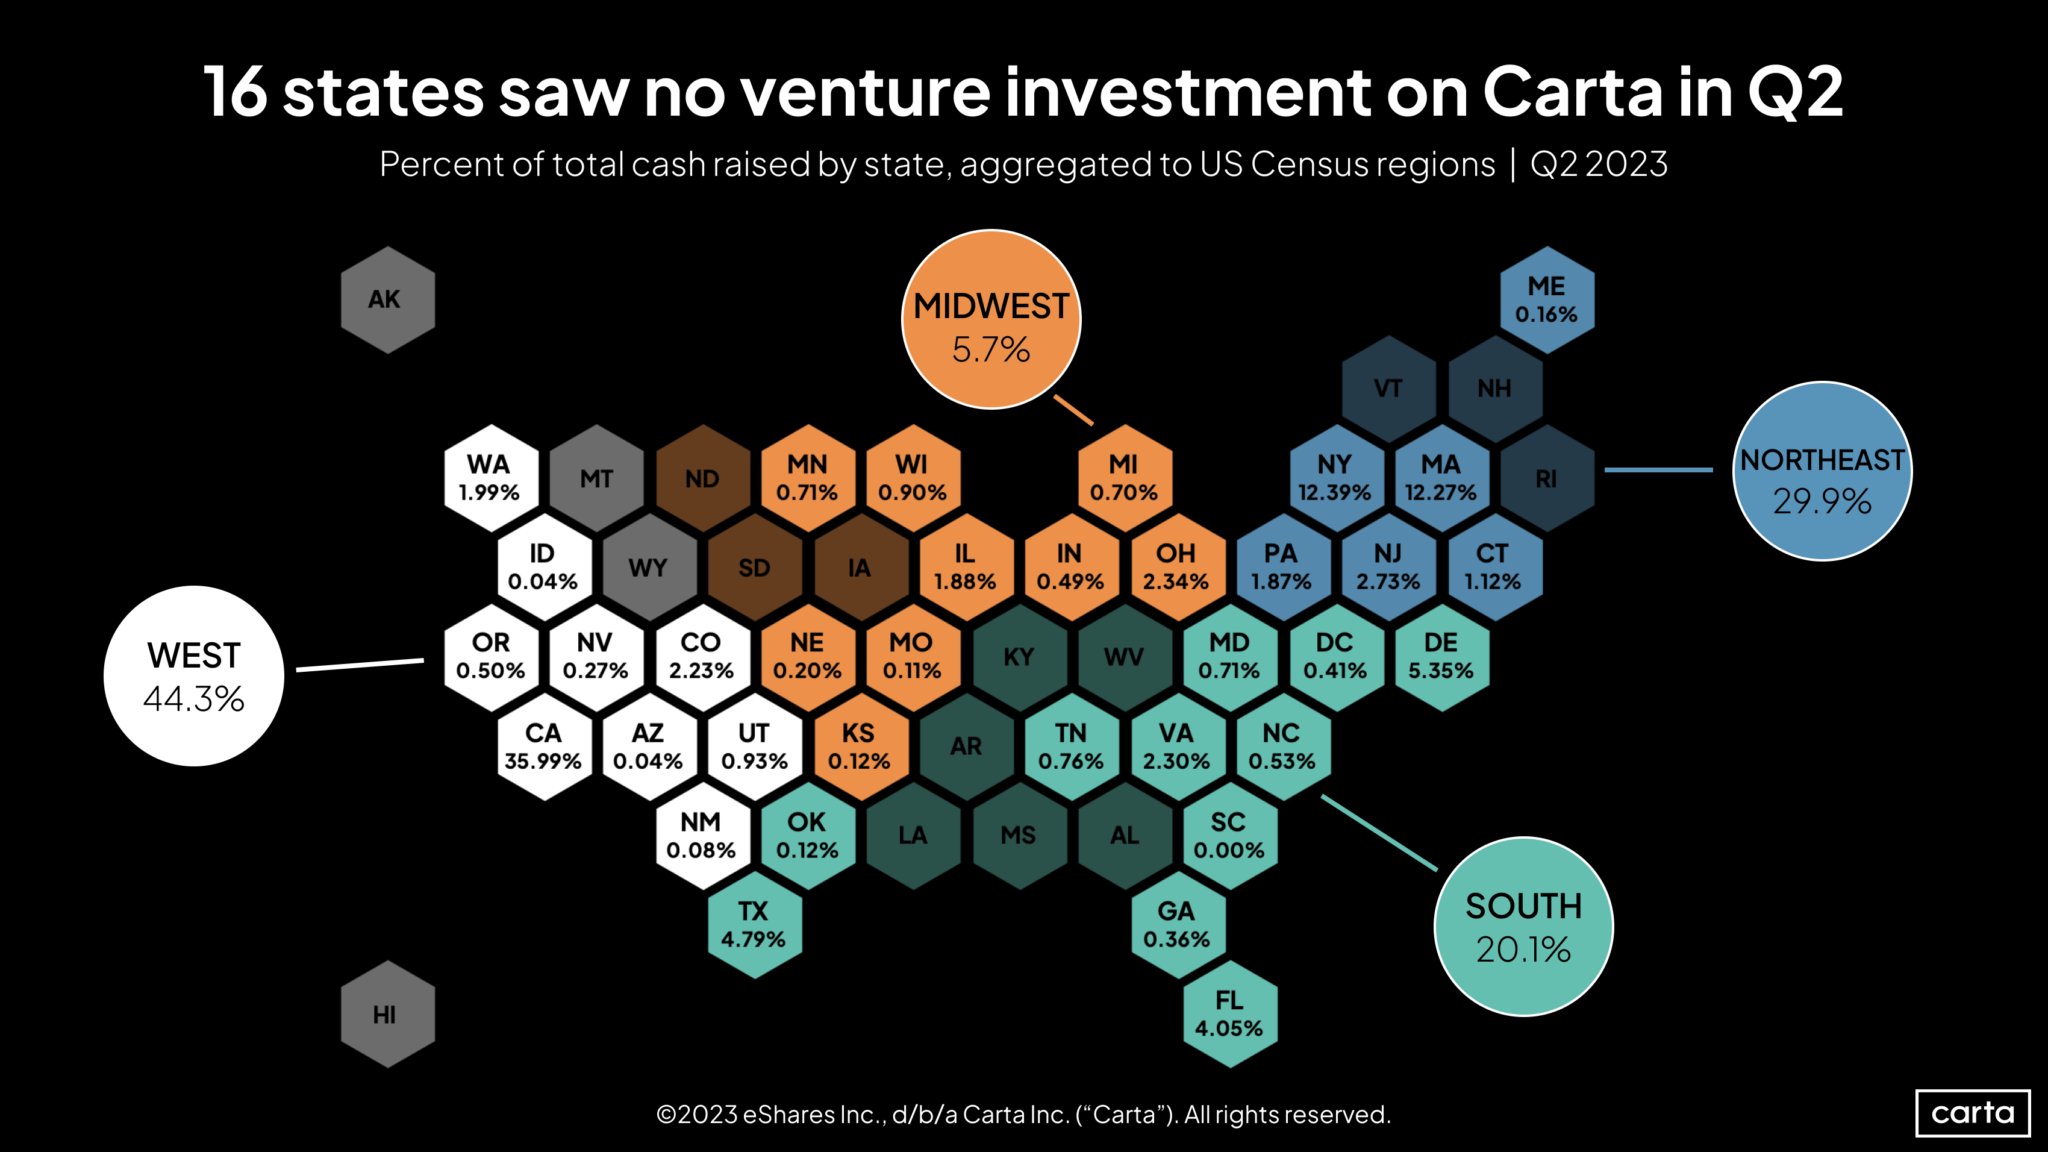
- VC Geographic Shift: The West census region saw a decrease from 51.2% to 44.3% in its share of venture capital, while the Midwest, South, and Northeast regions increased.
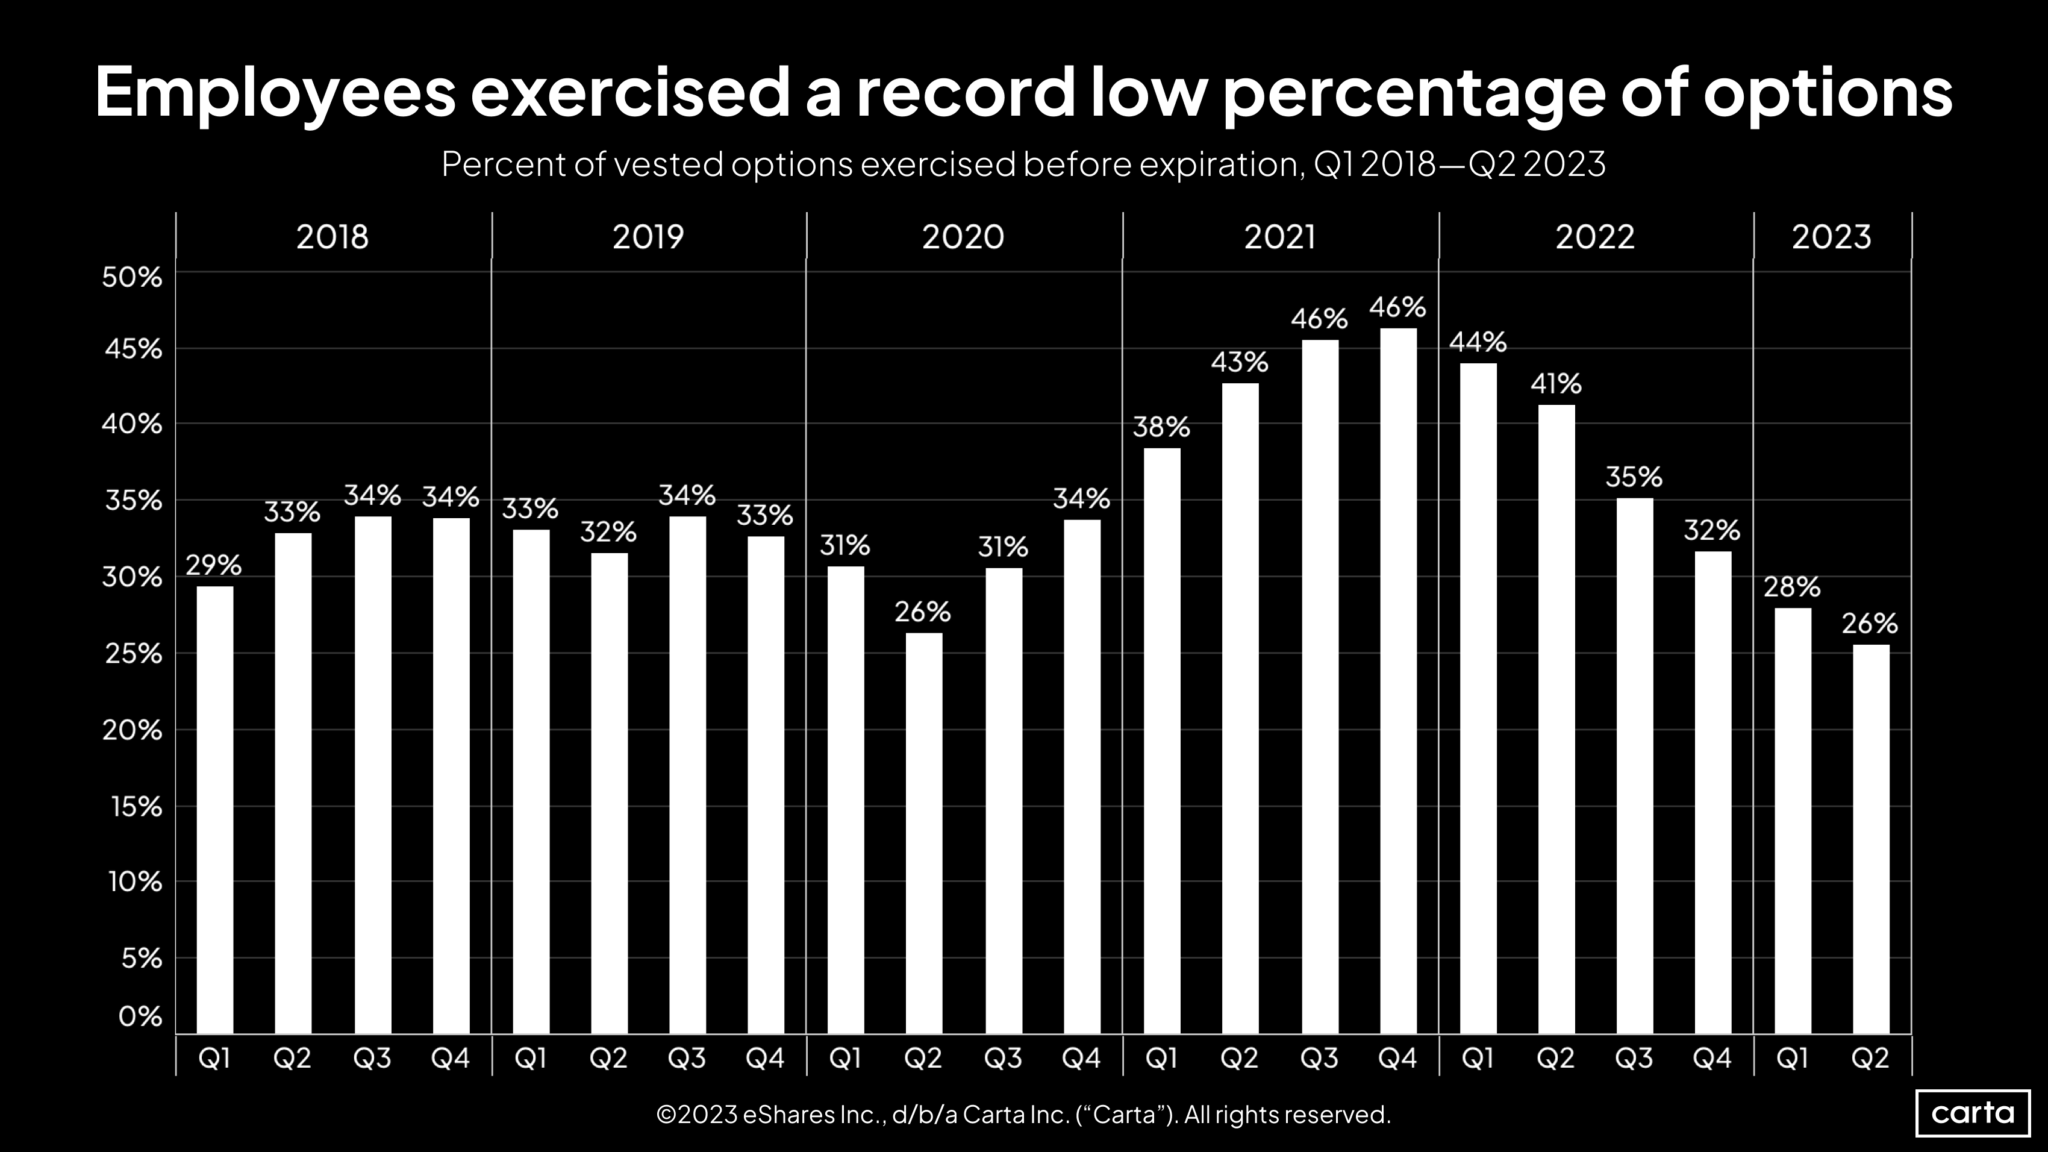
- Stock Options Not Being Exercised: In Q2, only 26% of vested stock options were exercised, the lowest since 2018’s beginning.
Note: Additional industry-specific data is available in the report’s addendum.
Key Trends
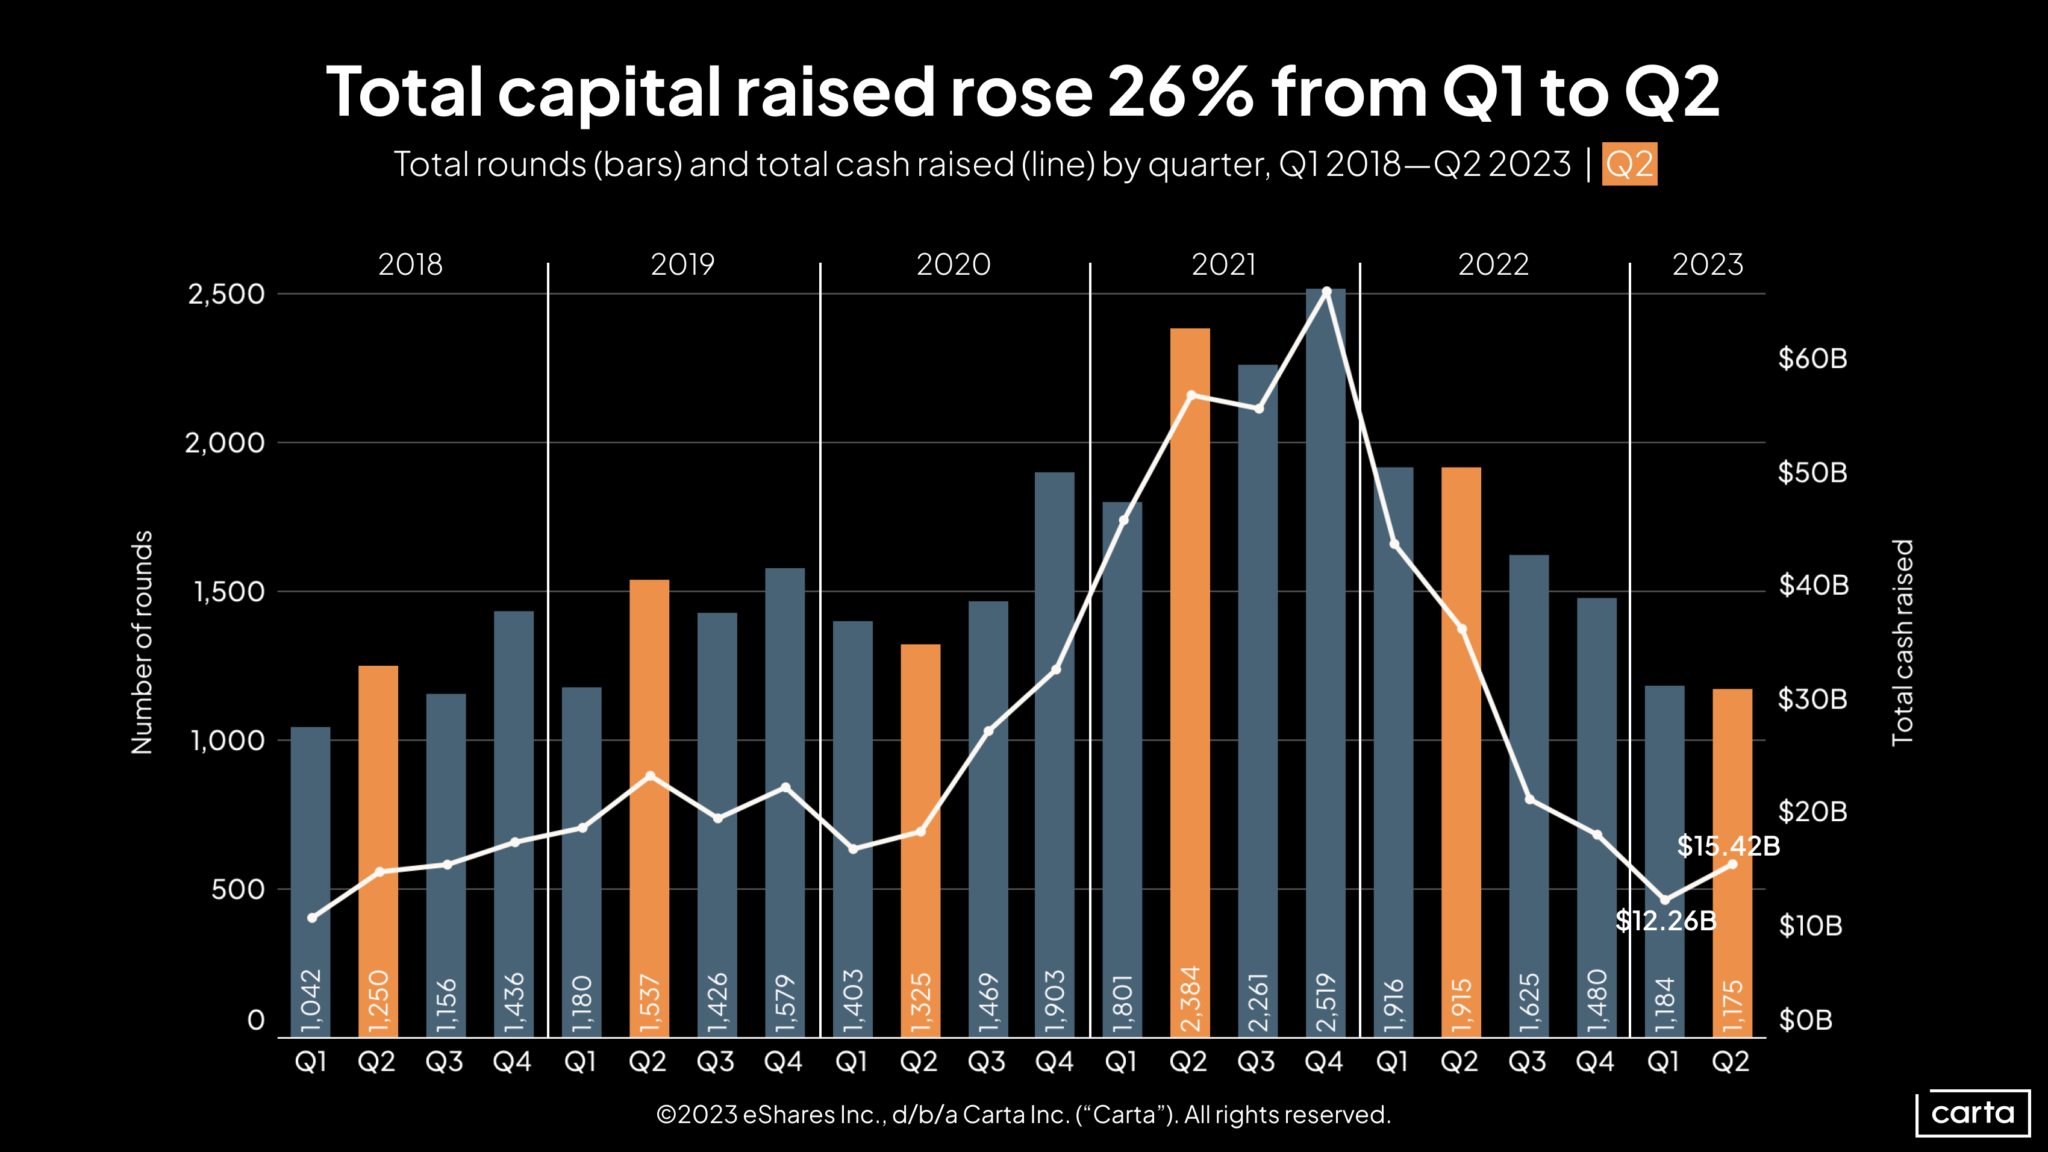
- Investment Size Increase: Despite the number of deals remaining steady, the average investment size grew from $10.4 million to $13.1 million.
- Slowest Q2 Since 2018: With both deal count and cash raised, 2023 is shaping up to be the quietest year since at least 2018.
- Start-up Valuation Reset: Nearly 19% of Q2 fundings on Carta were down rounds, the third straight quarter above 15%.
- Venture Activity Cooling in the West: The West’s share of investments decreased, while other regions have seen a relative increase.
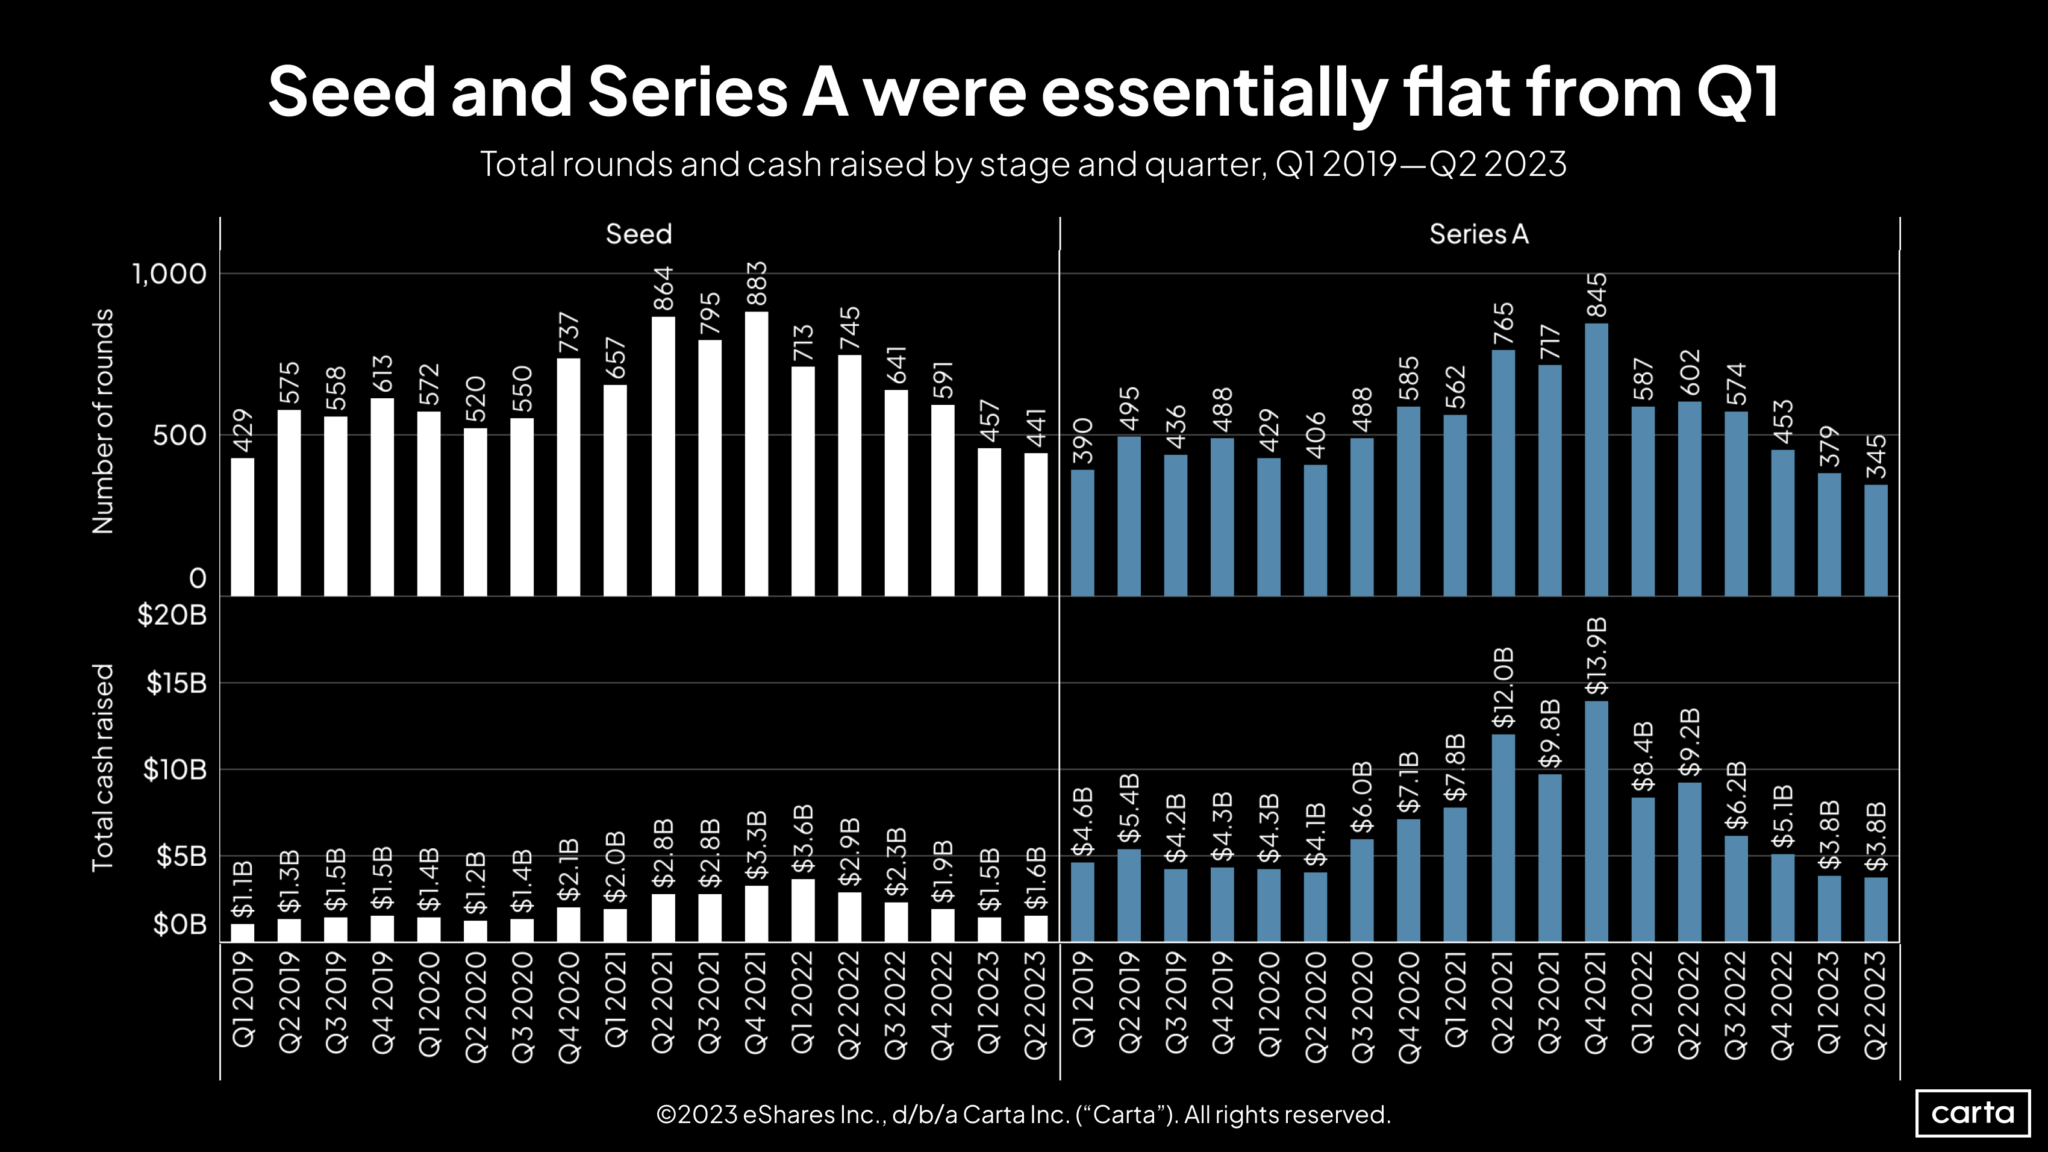
- Little Change at Early Stages: Seed and Series A saw a slight decline, with Q2 equaling Q1’s low $3.8 billion for Series A.
- Bounce Back in Series B and C: Increases in both deal count and cash raised for Series B and C, although still relatively low compared to recent years.
- Potential Rebound in Late-stage: Series D and beyond are showing signs of recovery, but still well below the highs of 2021.
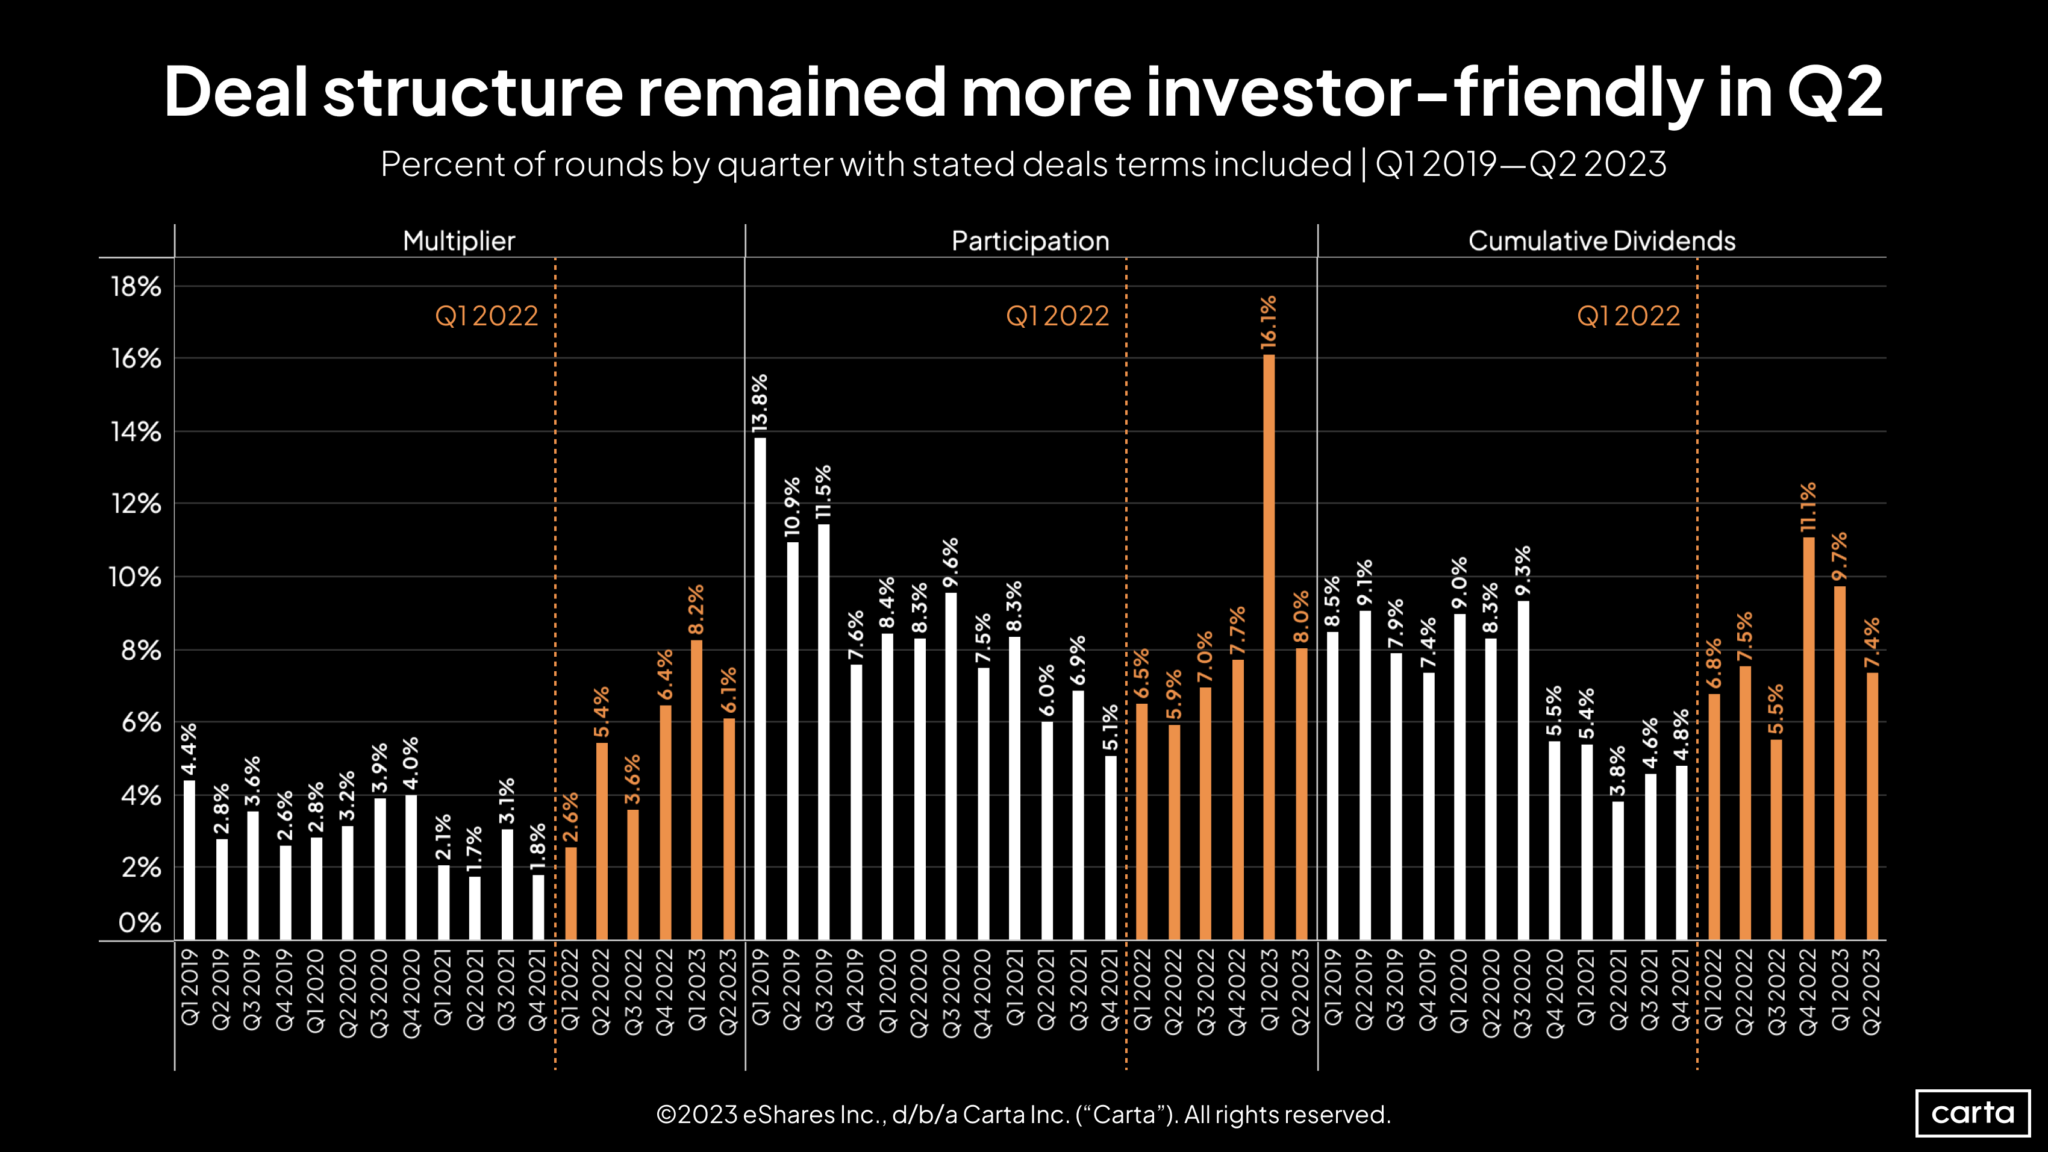
- Structured Deals Decreasing: In Q2, deals with multipliers, participation, and cumulative dividends fell back to recent norms, indicating a potential upswing in the market.
Graphical Insights
- Total Rounds and Cash Raised (Q1 2018-Q2 2023): Displays a steady rise in investment size but slowest Q2 in recent history.
- Down Rounds Percent (Q1 2018-Q2 2023): Illustrates the shift in valuation landscape, with down round rates increasing for five straight quarters after the market downturn.
- Cash Raised by US Census Regions (Q1 2018-Q2 2023): Shows the West’s gradual decline in its share of funding, while the South’s share has significantly risen.
- Rounds and Cash Raised by Stage (Q1 2019-Q2 2023): Presents the slight changes in early stages and the quarter-over-quarter growth at Series B, C, D, and E+.
- Deals with Stated Terms (Q1 2019-Q2 2023): Reflects a decrease in structured deals, signaling a potential market recovery.
The current state of the private markets as of Q2 2023 reflects a cautious optimism. The venture market seems to be gradually stabilizing, and although the pace is far from the peak levels of recent years, signs of recovery are evident. The landscape, however, is complex, with shifts in geographic distribution of funding, startup valuations, and investment structures. Continued monitoring and strategic planning will be essential for stakeholders navigating these evolving trends.
Fundraising and Valuations: A Quarterly Overview (Q1 2019 – Q2 2023)
Mega-Deals
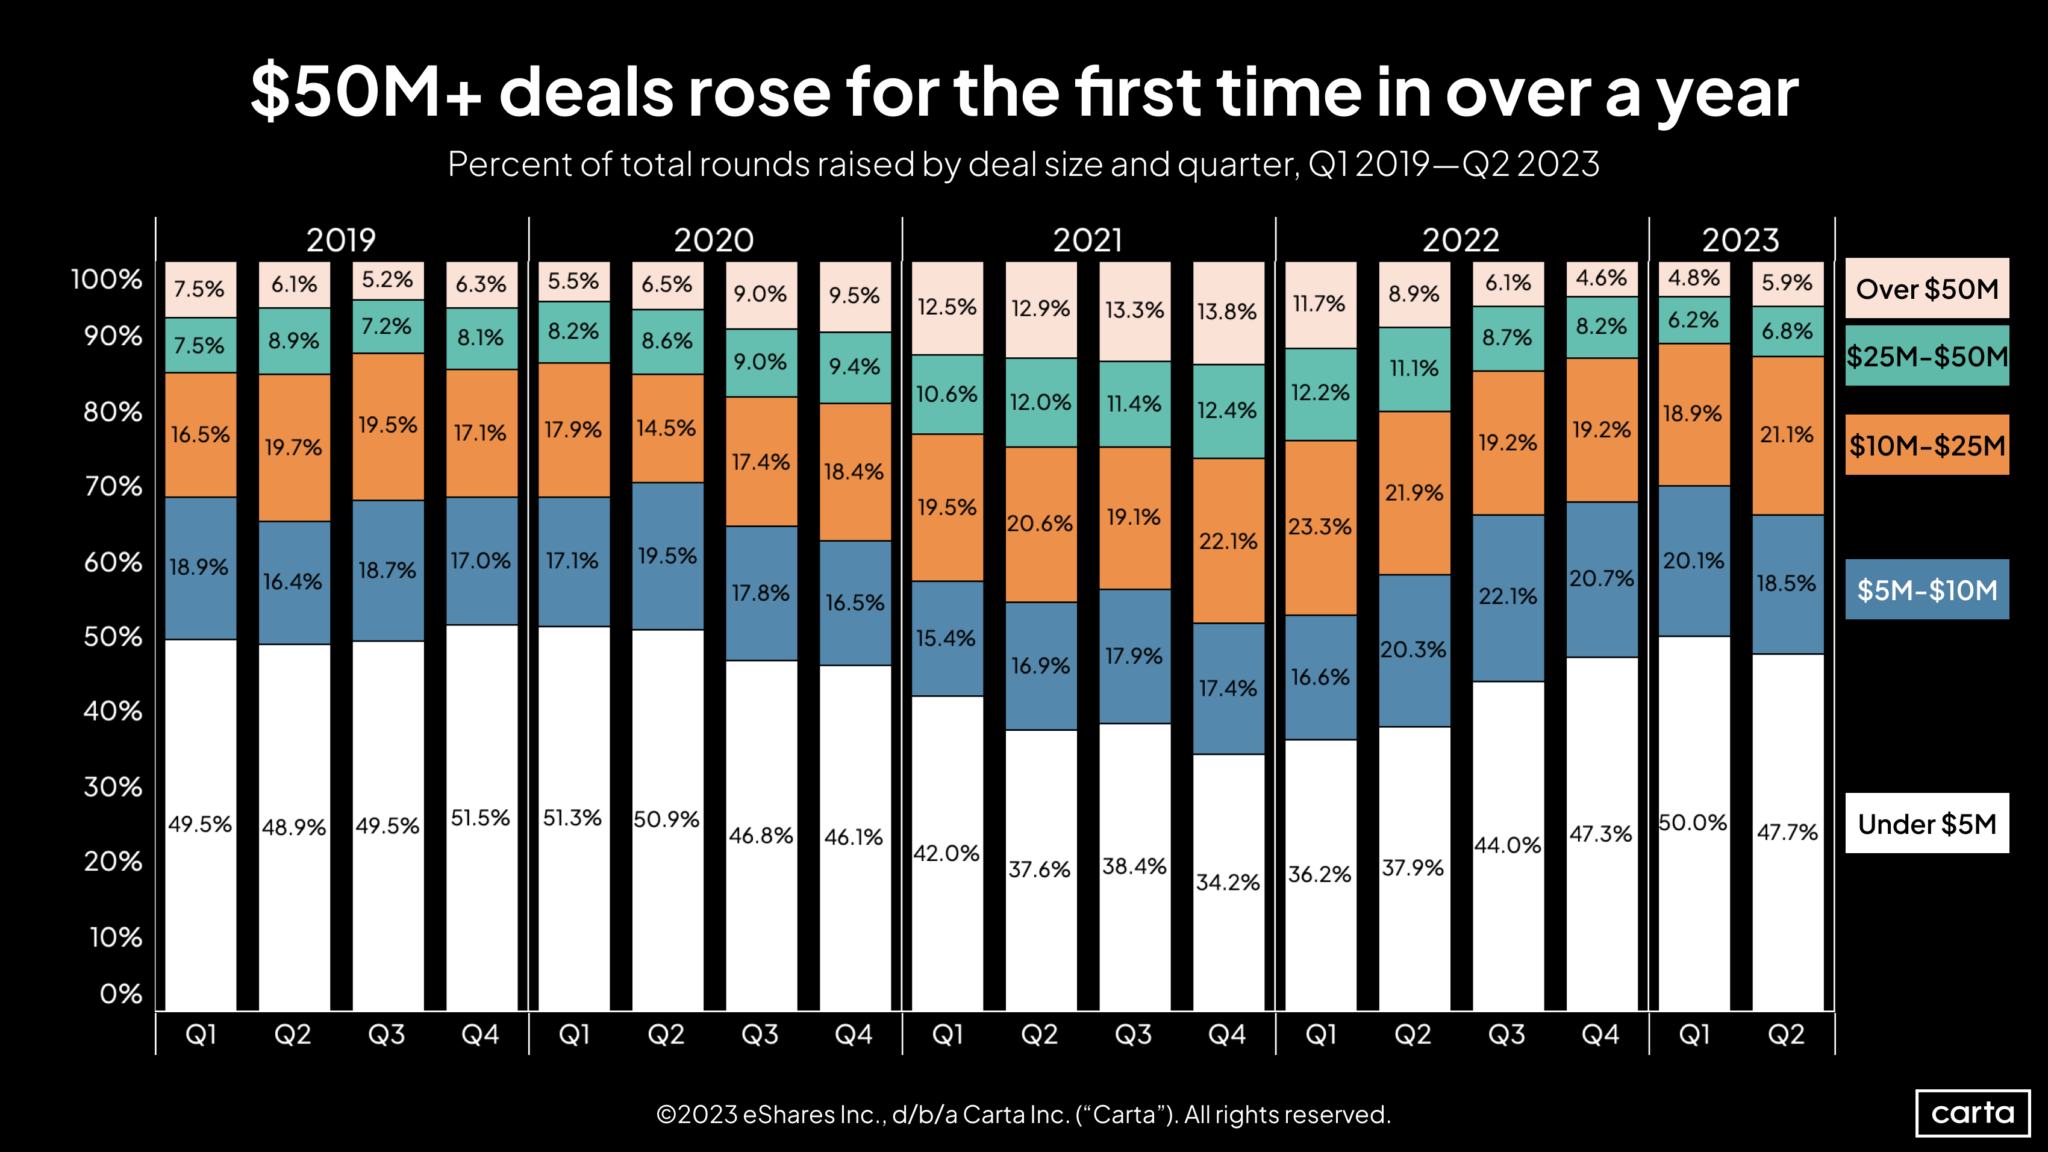
- Increased frequency in Q2, with 5.9% of venture investments over $50 million, up from 4.8% in Q1.
- More than twice as rare in Q2 2023 compared to any quarter in 2021.
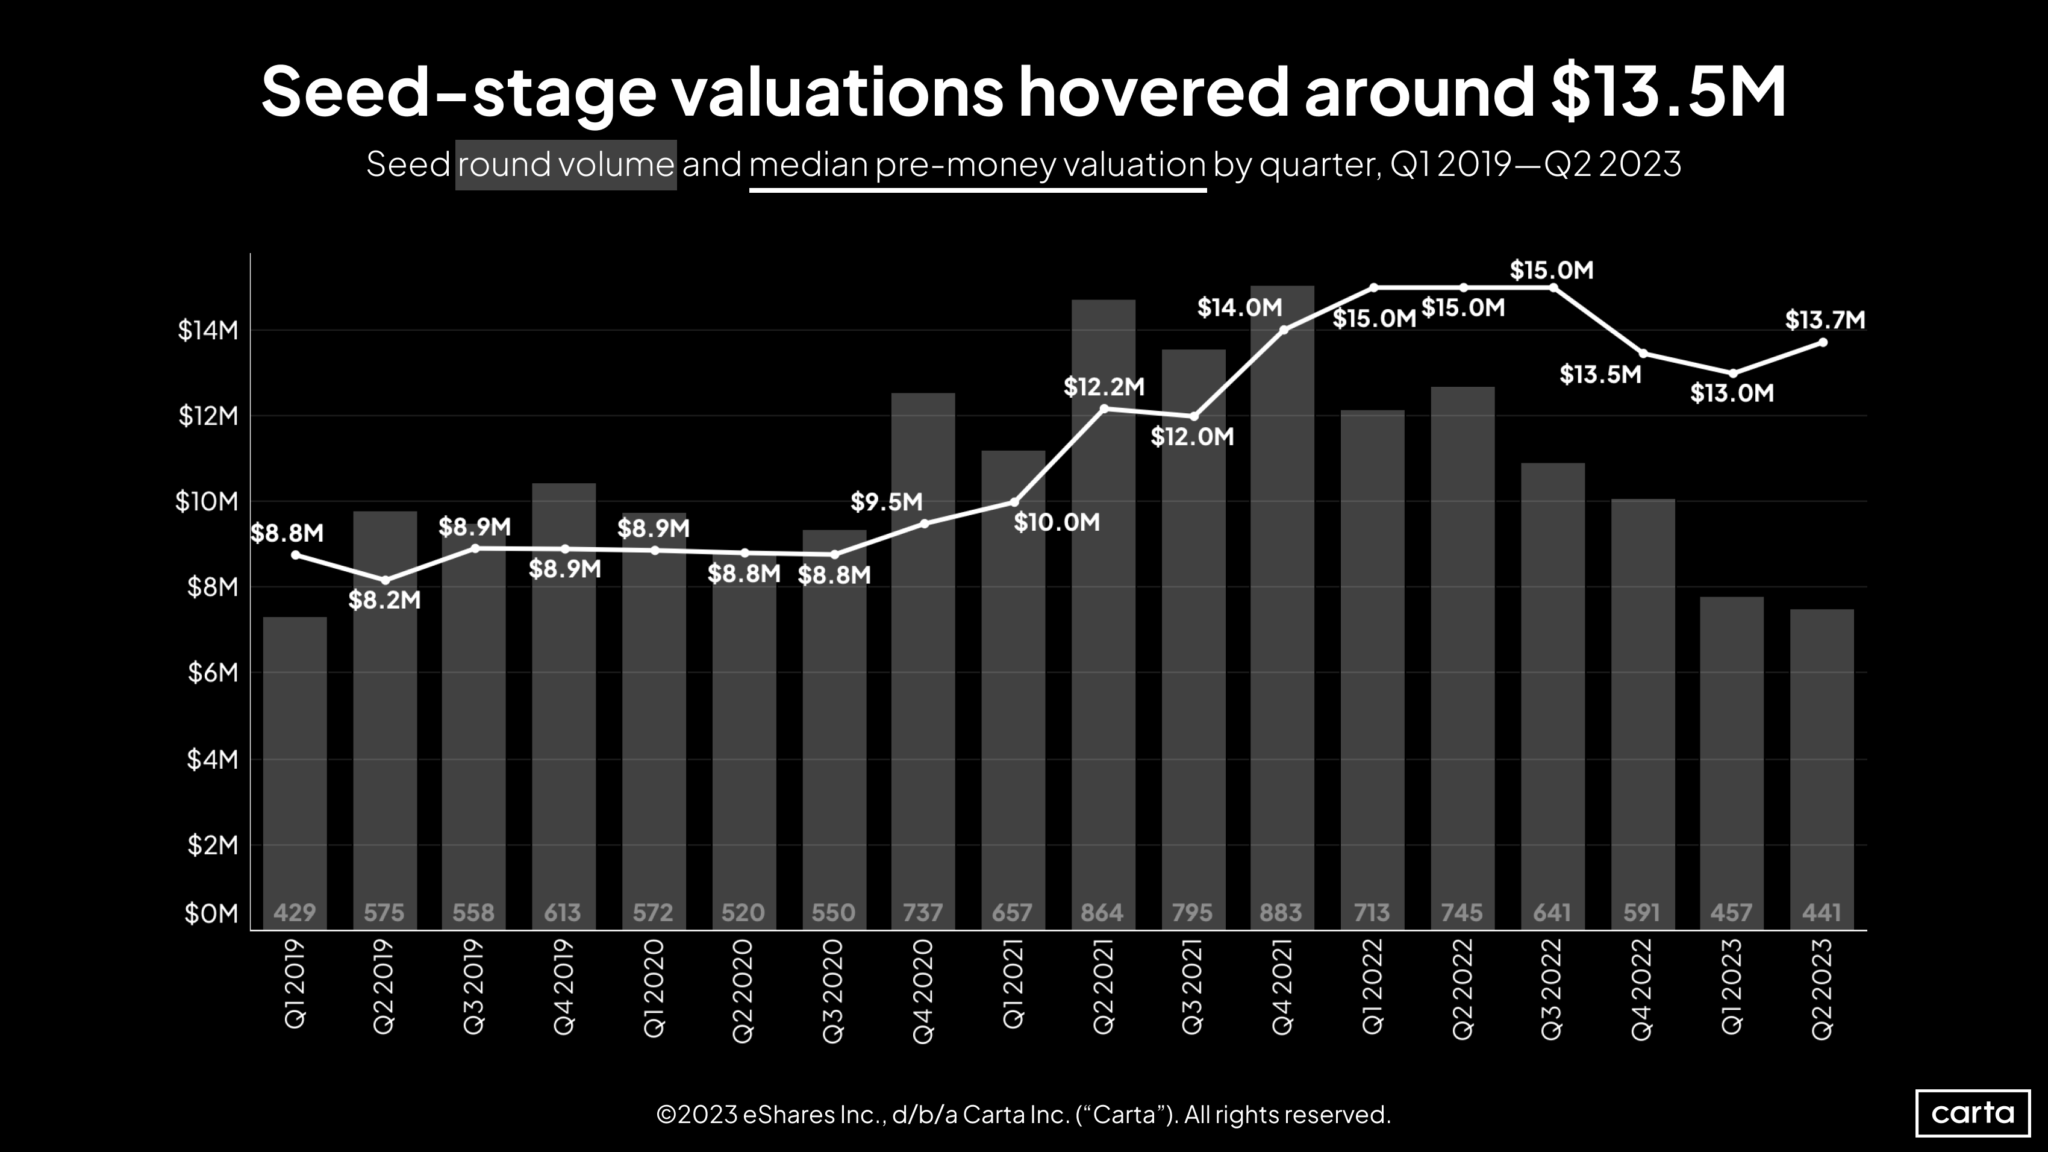
Seed Rounds
- Median valuation of $13.7 million in Q2, a 5% increase from Q1, though below the 2021 peak of $15 million.
- Deal count dropped for four consecutive quarters.
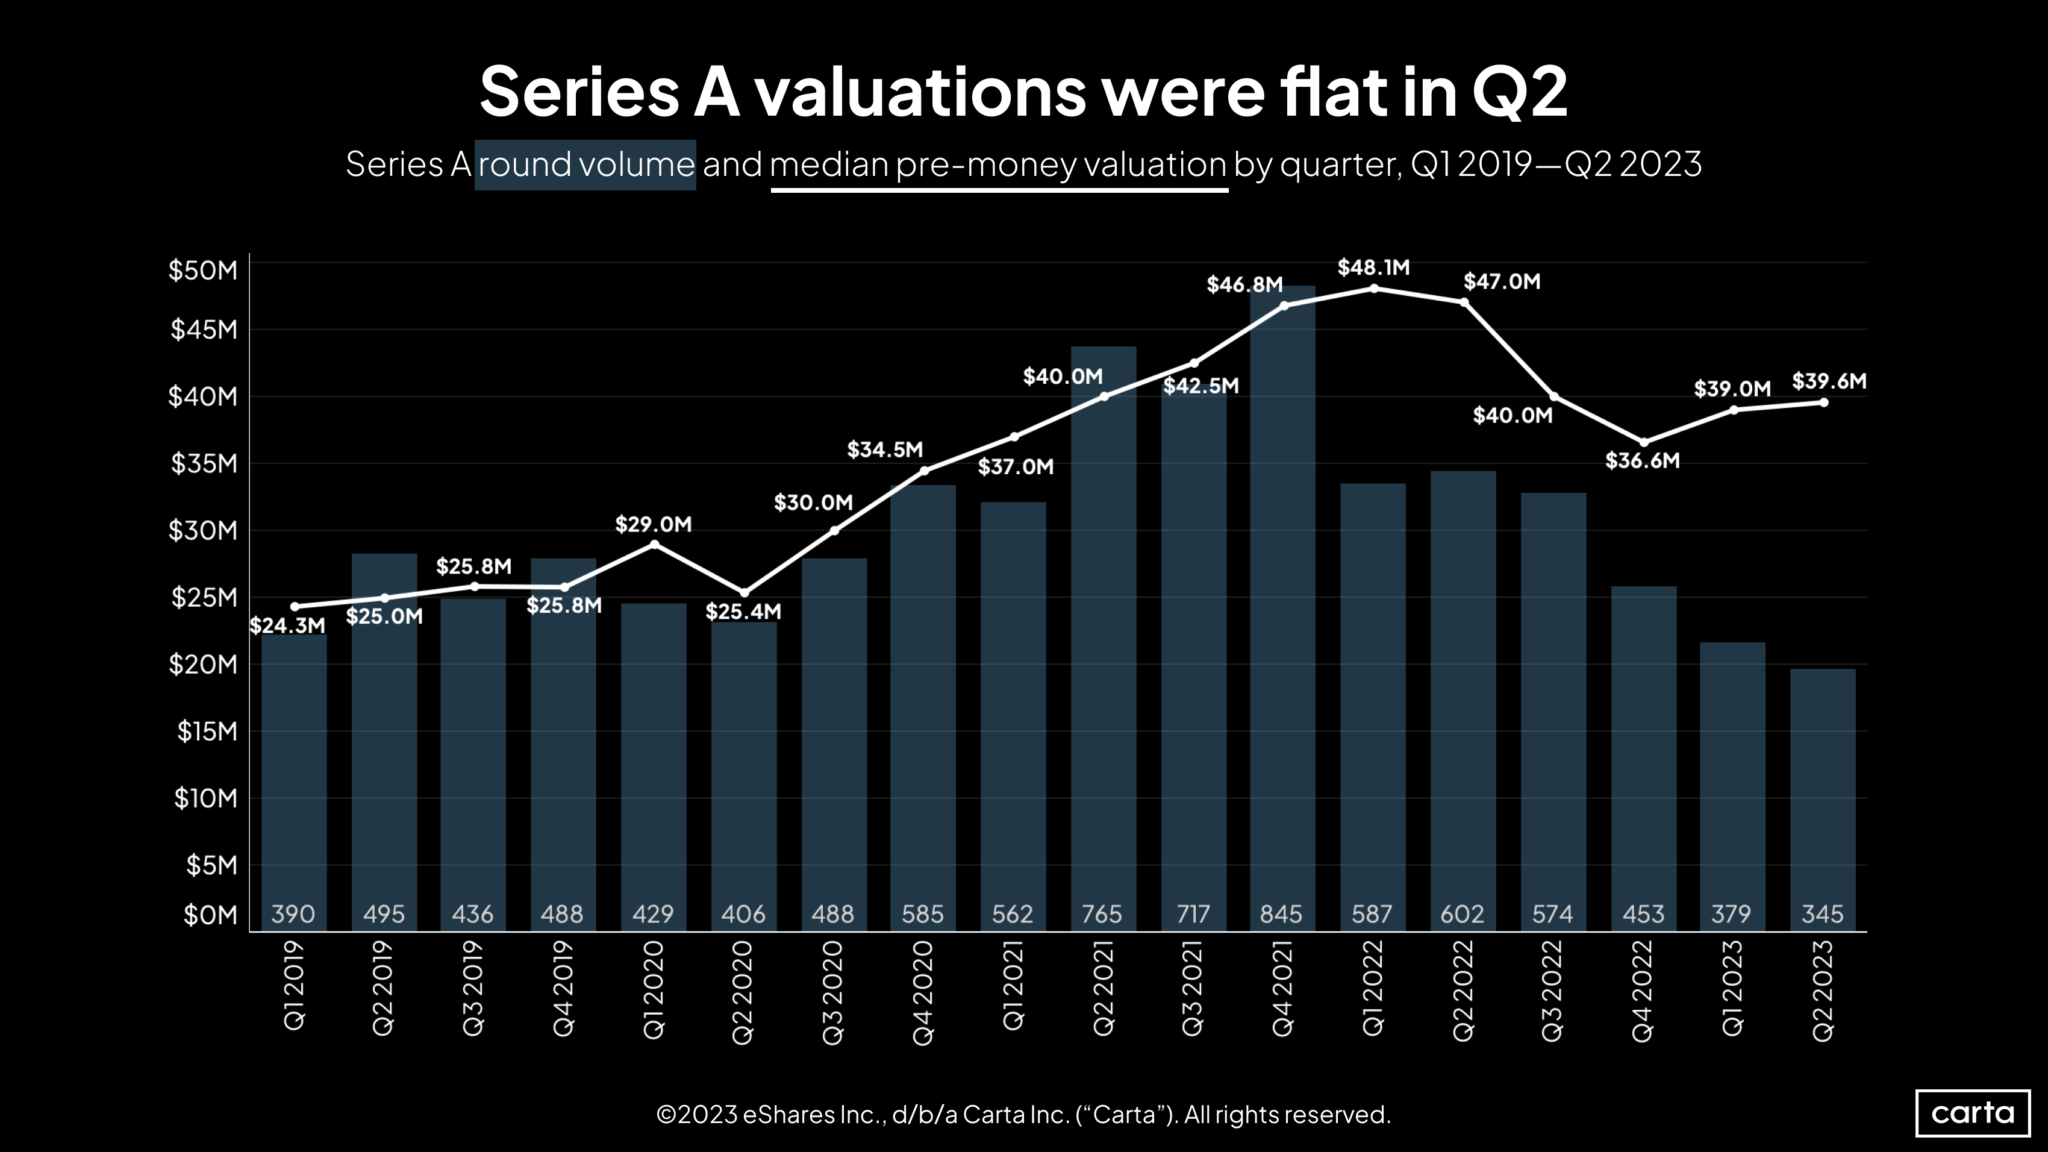
Series A Rounds
- Q2 median valuation of $39.6 million, with two straight quarterly increases.
- Three straight quarterly declines in deal count, indicating possible selective success in raising Series A rounds.
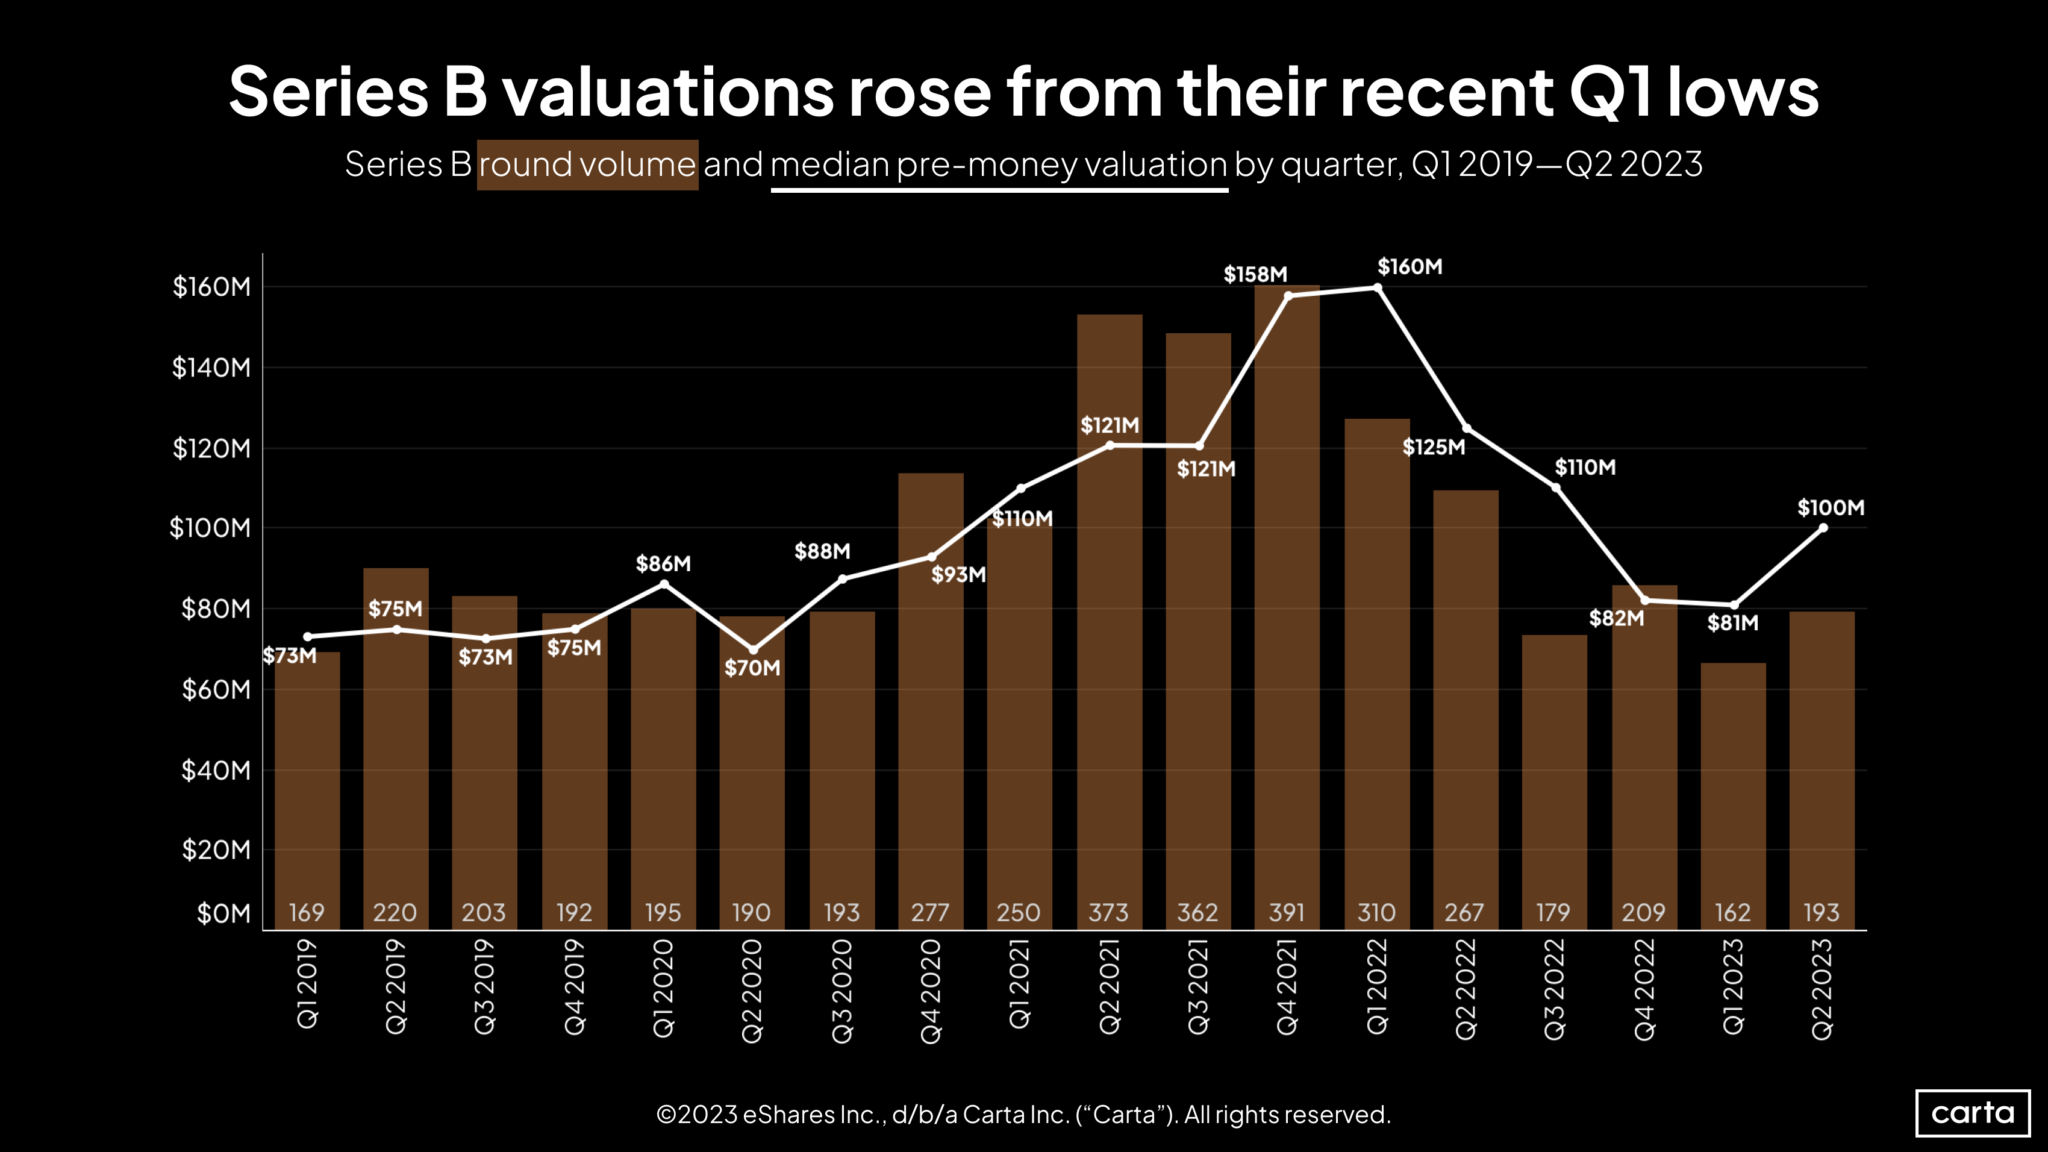
Series B Rounds
- Median valuation reached $100 million in Q2 (23% QoQ increase), and deal count increased by 19%.
- Sentiment trending upwards.
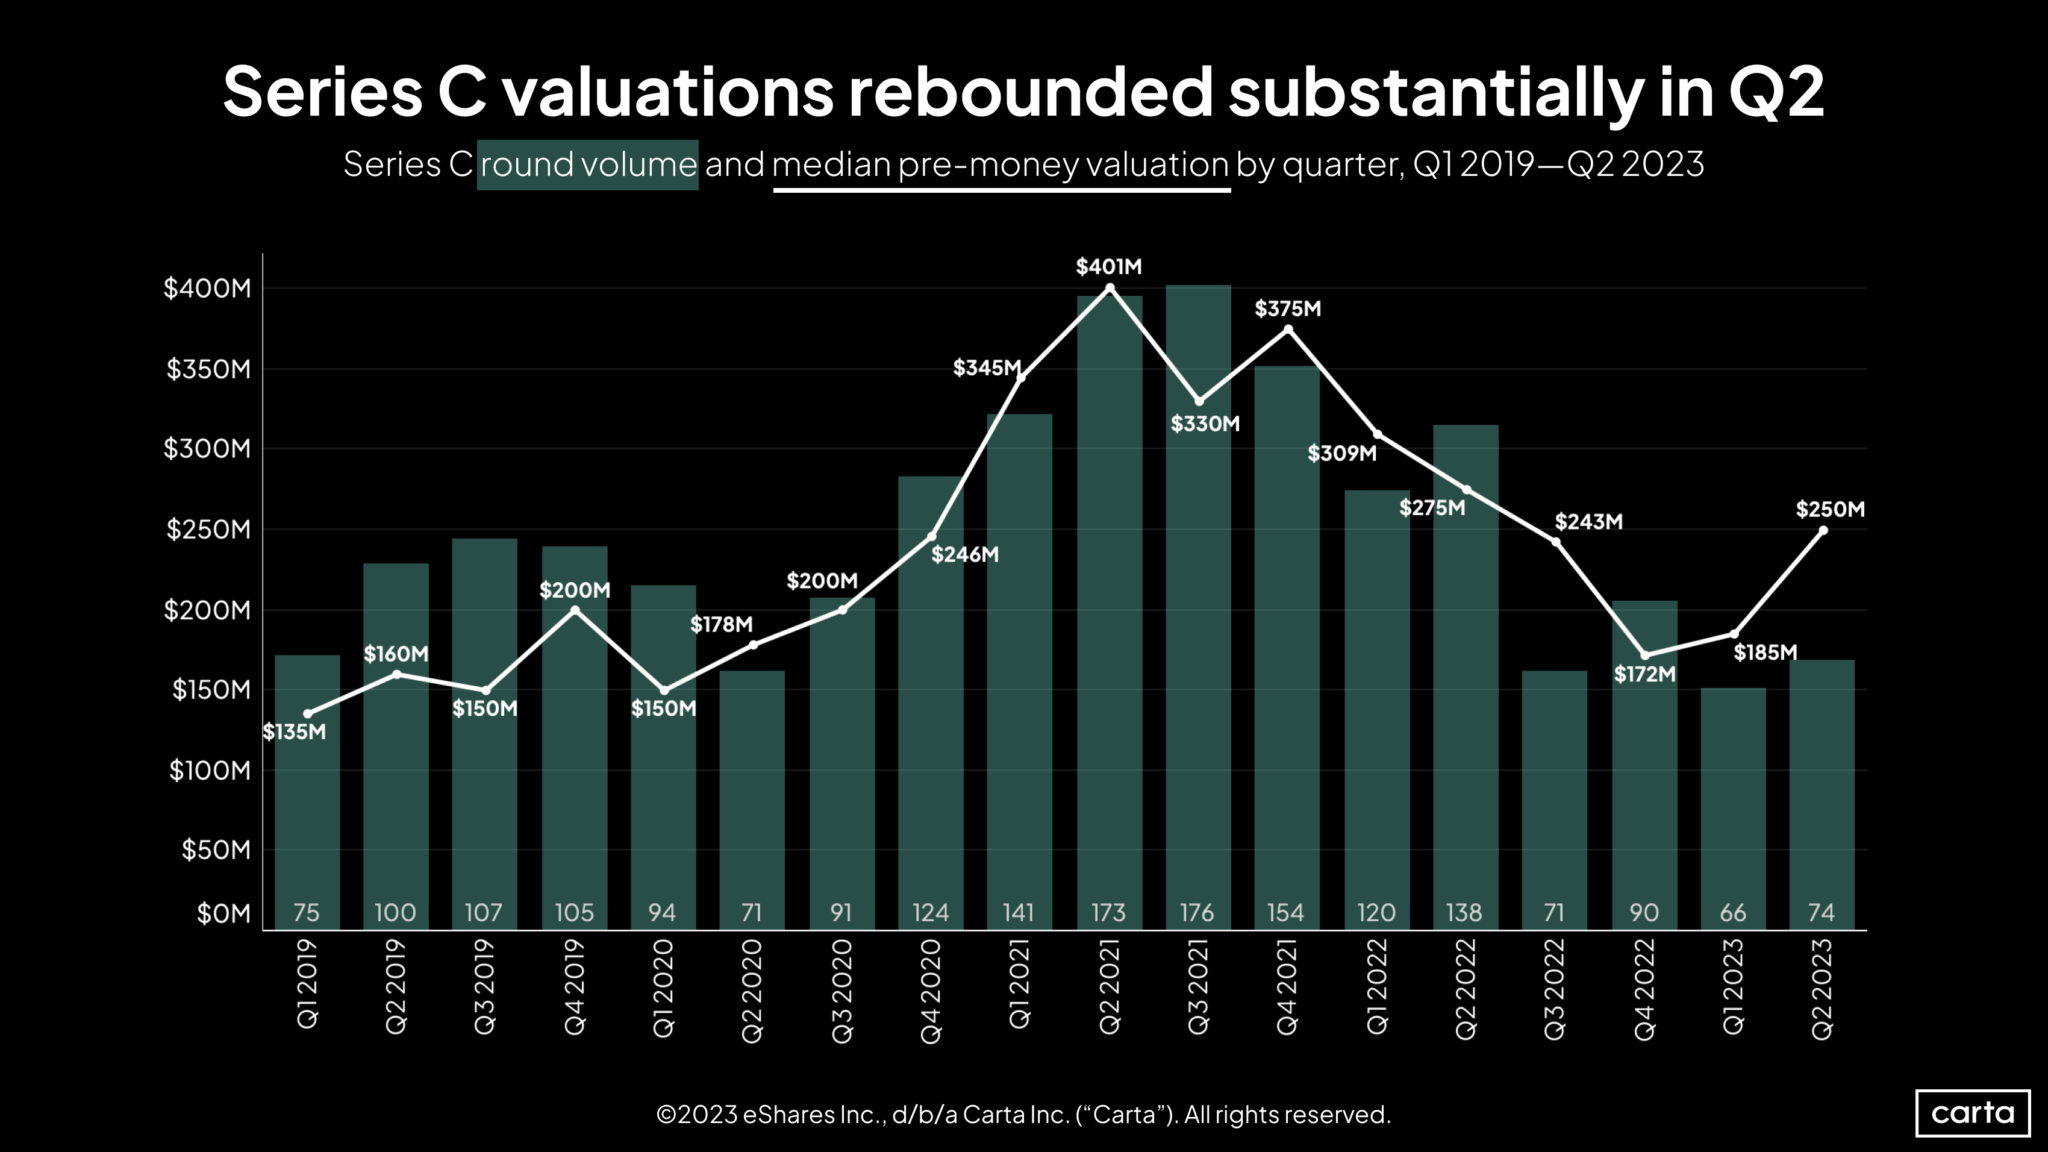
Series C Rounds
- Median valuation up 35% in Q2, highest in four quarters.
- Deal count increased 12% QoQ but remains low historically.
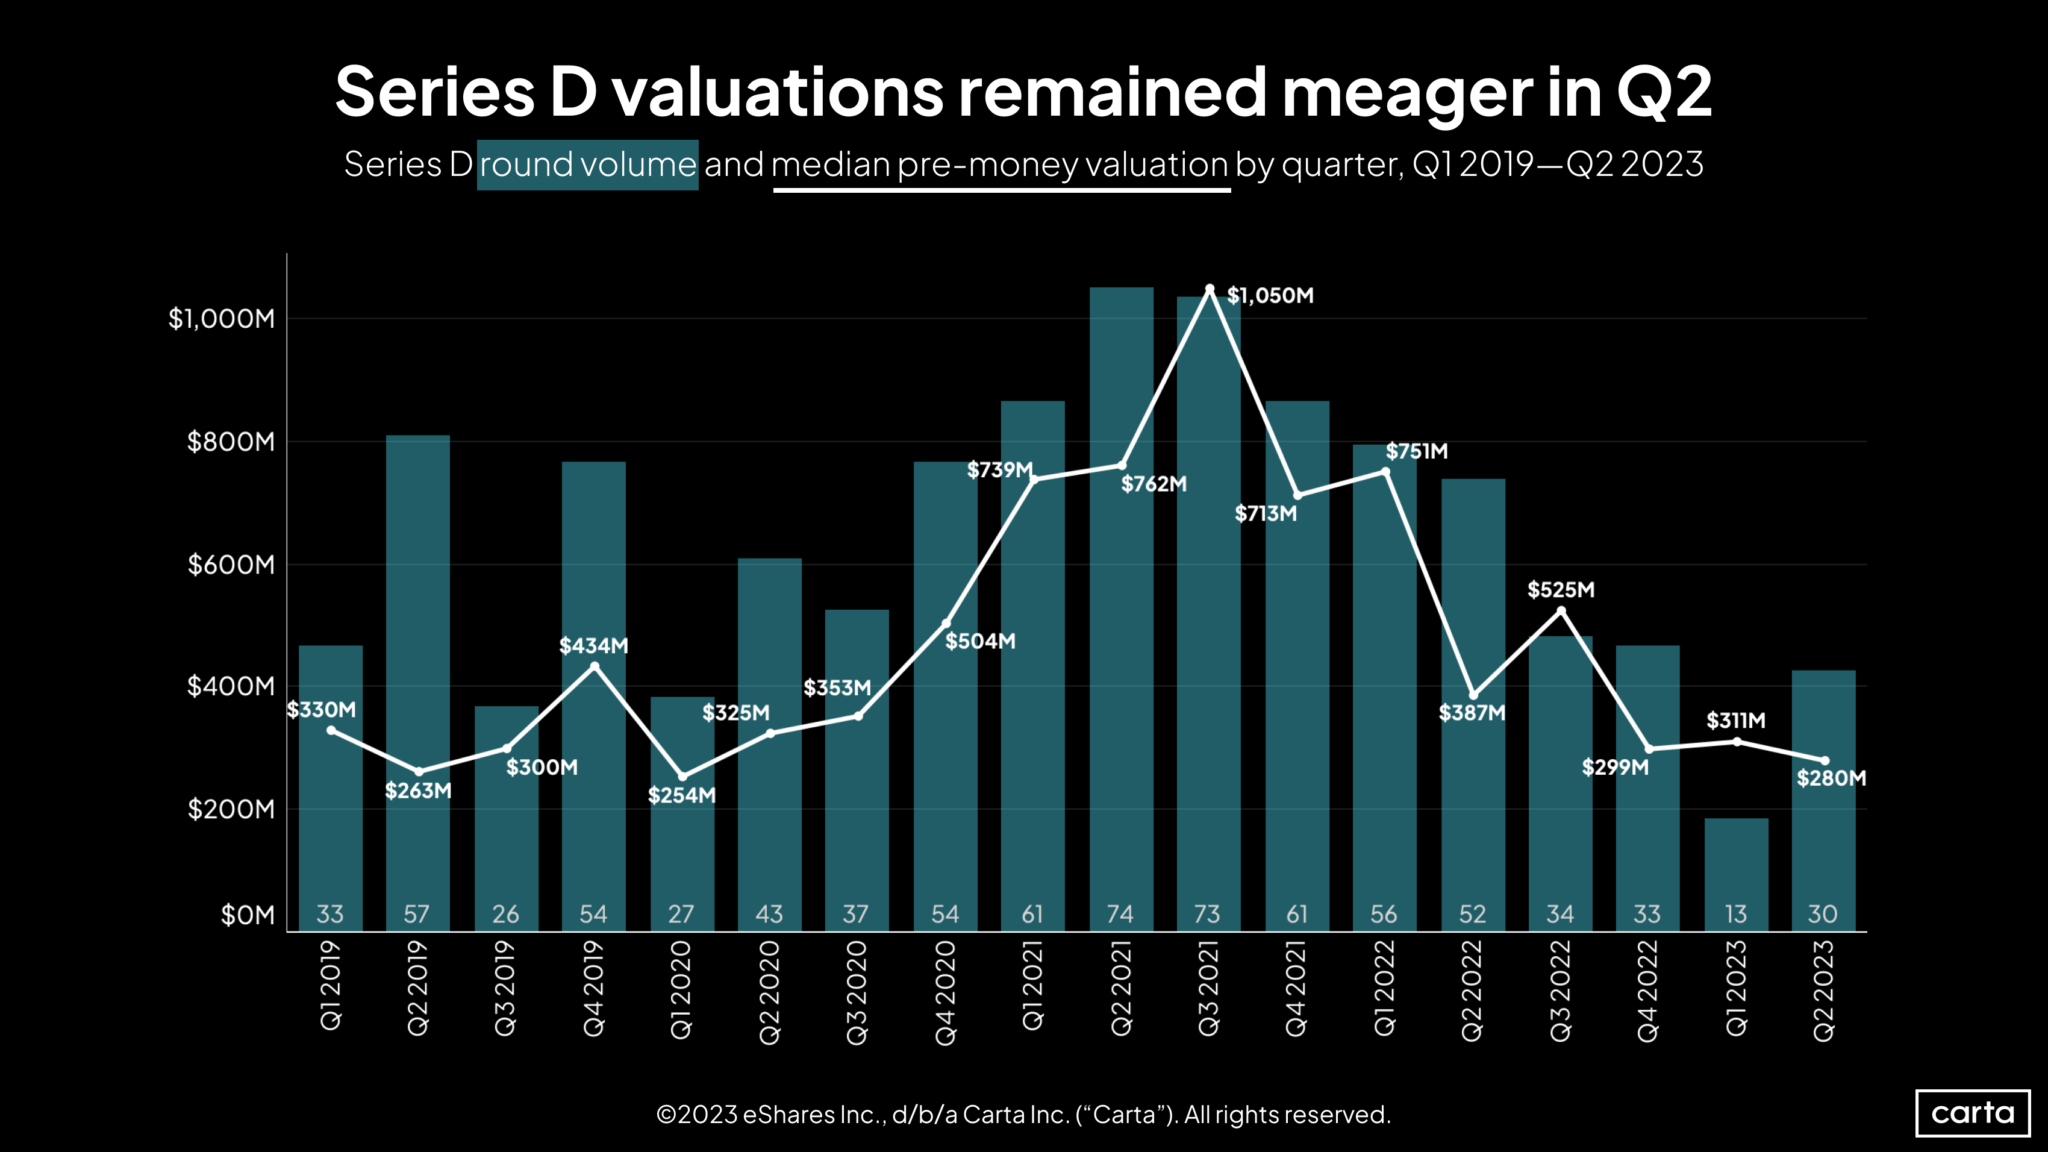
Series D Rounds
- Deal count more than doubled between Q1 and Q2, signifying possible positive shift.
- Median valuation declined 10% compared to Q1, continuing a deceleration trend.
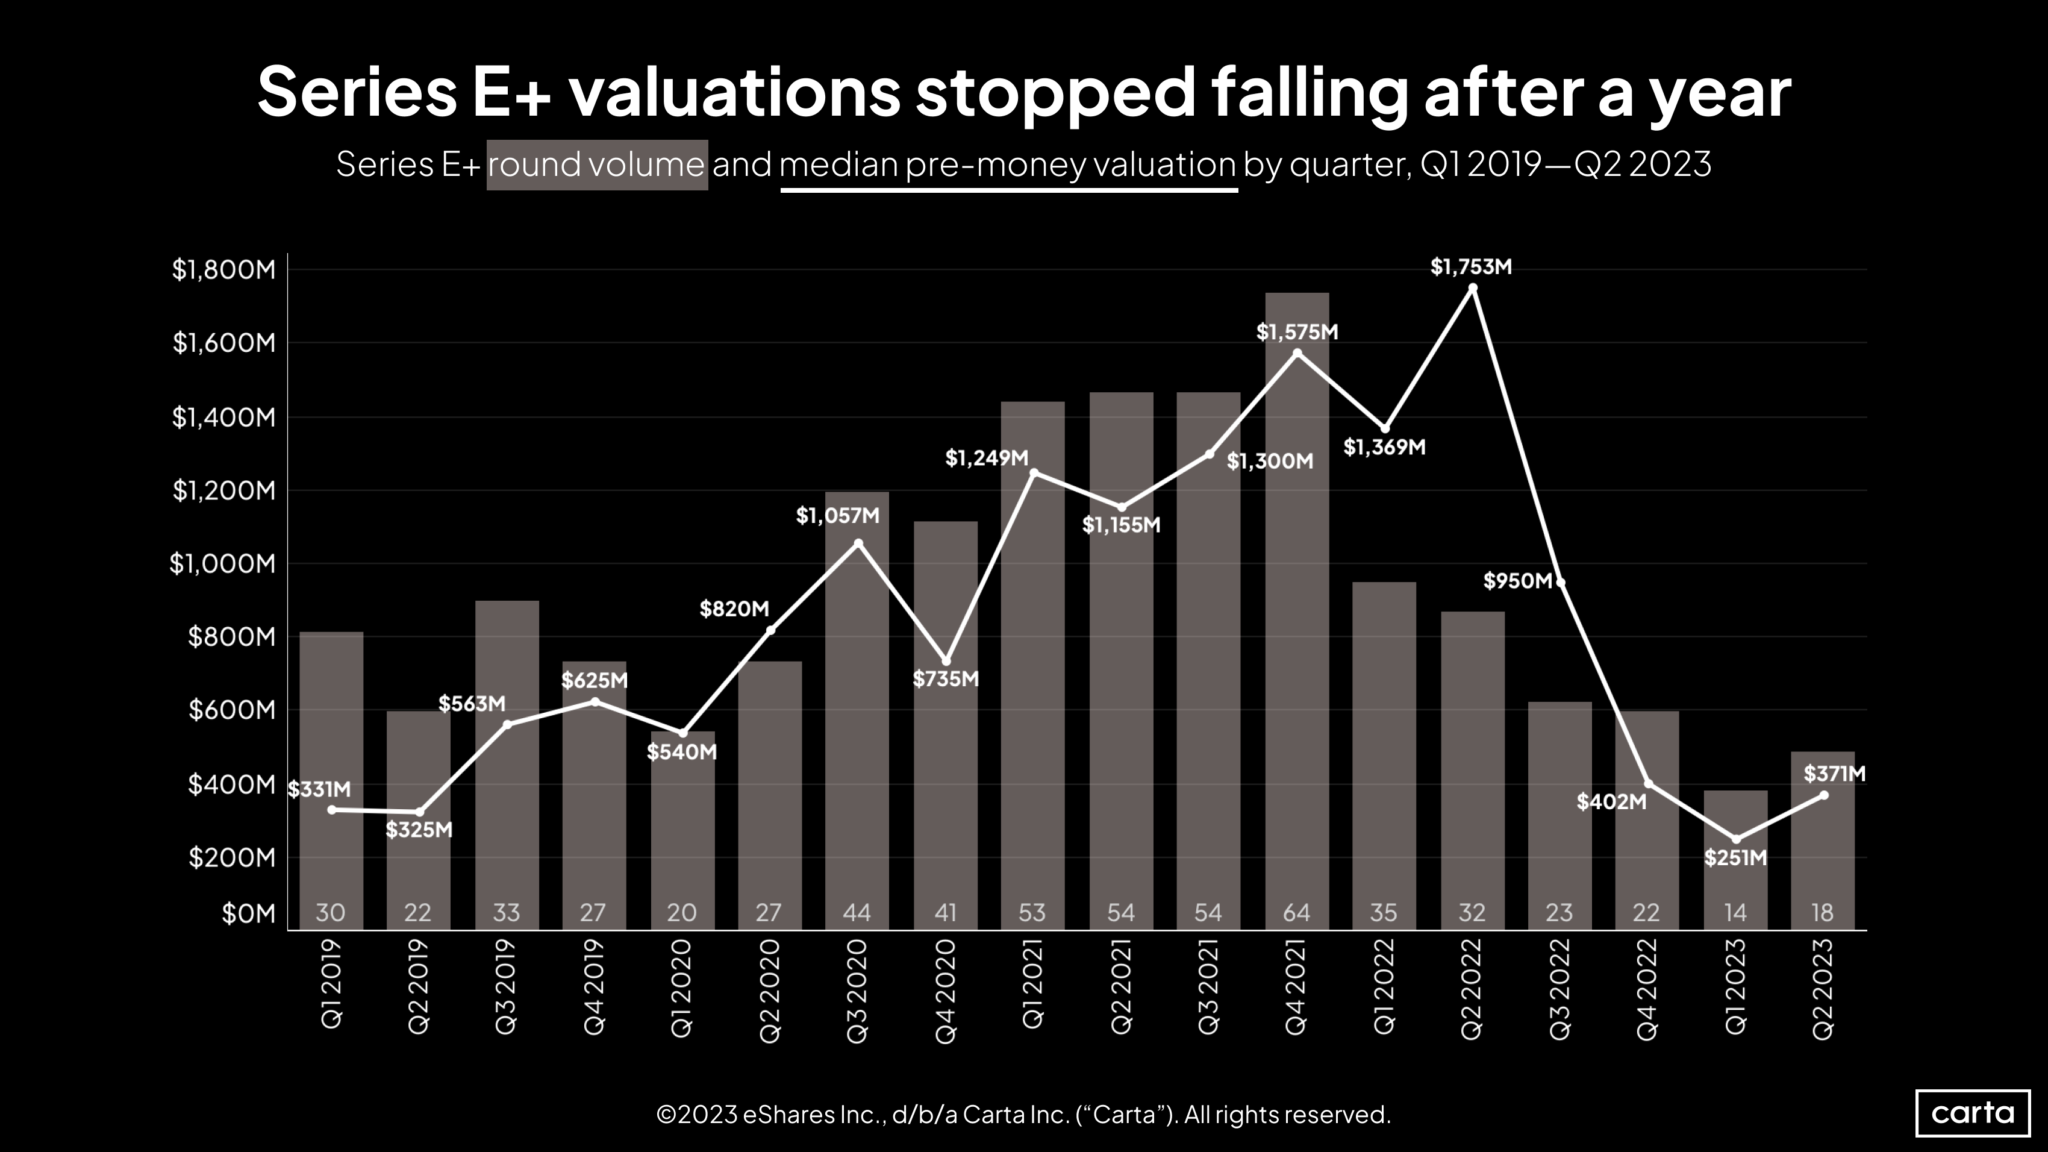
Series E+ Rounds
- Increases in both deal count (29%) and median valuation (48%) in Q2.
- Activity and valuations remain low within a longer-term context.
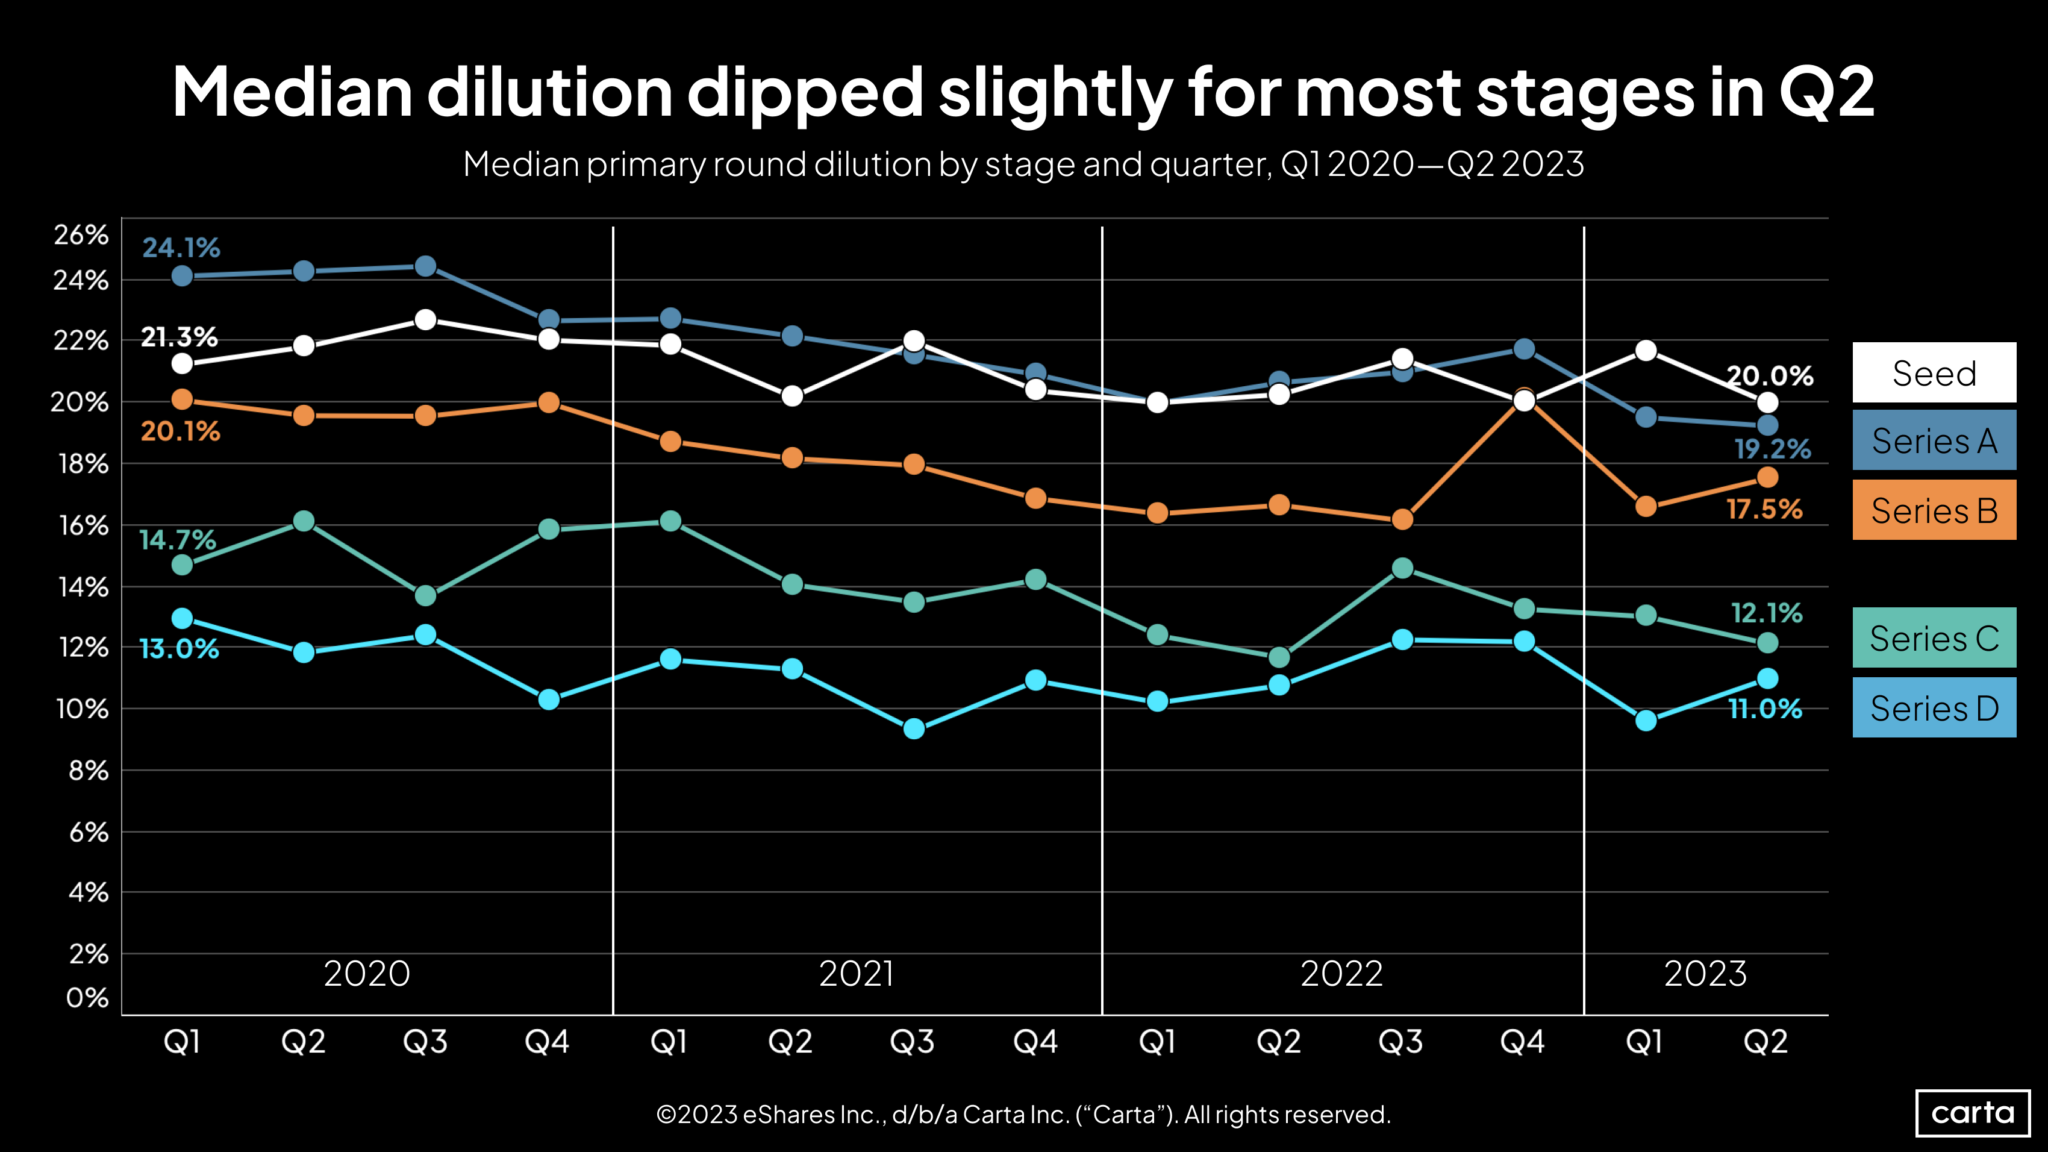
Median Primary Round Dilution (Q1 2020 – Q2 2023)
- Generally down at seed, Series A, and Series C, while up at Series B and Series D.
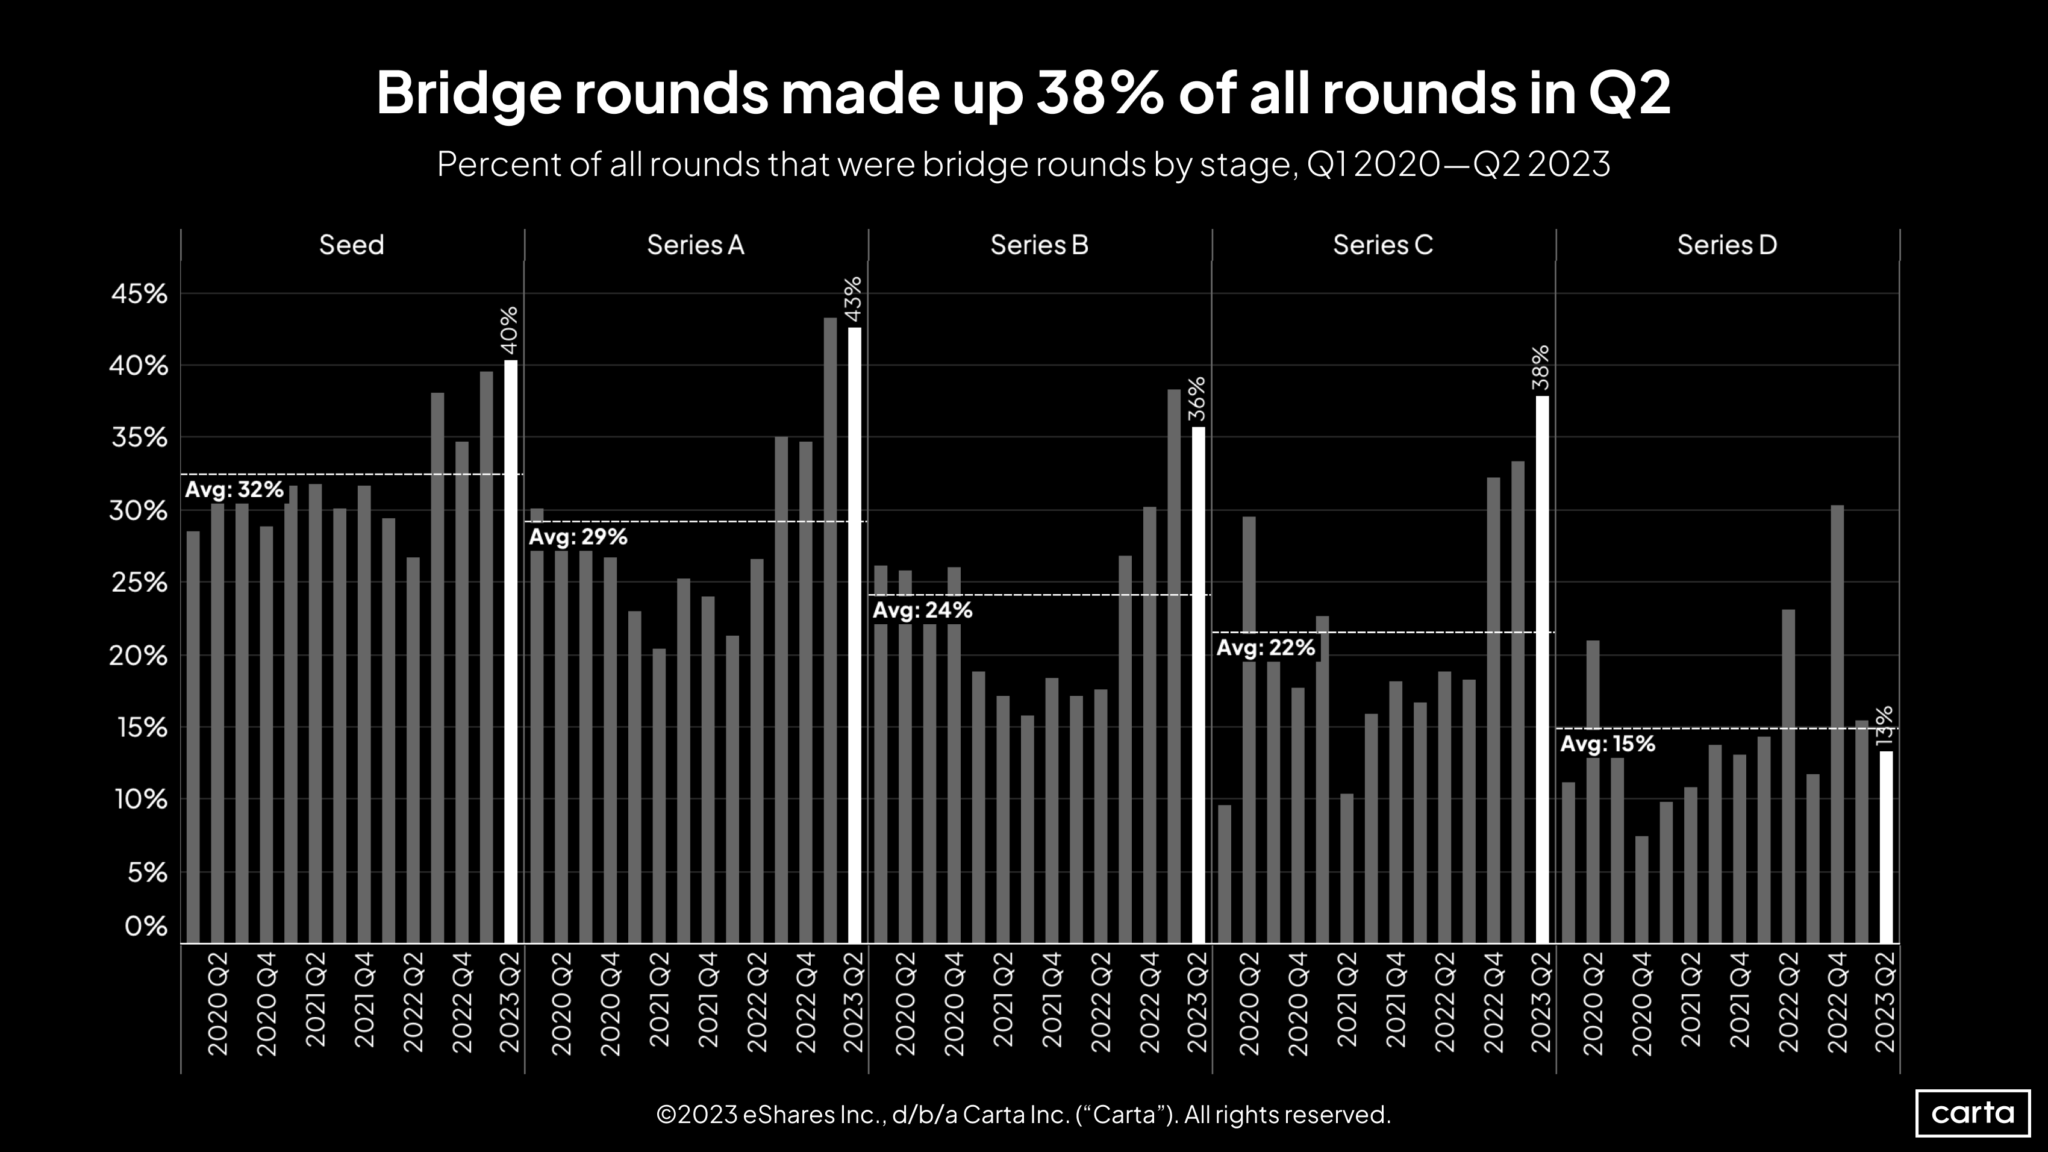
Bridge Rounds (Q1 2020 – Q2 2023)
- More popular at every stage from seed to Series C in Q2, notably at Series C (38%).
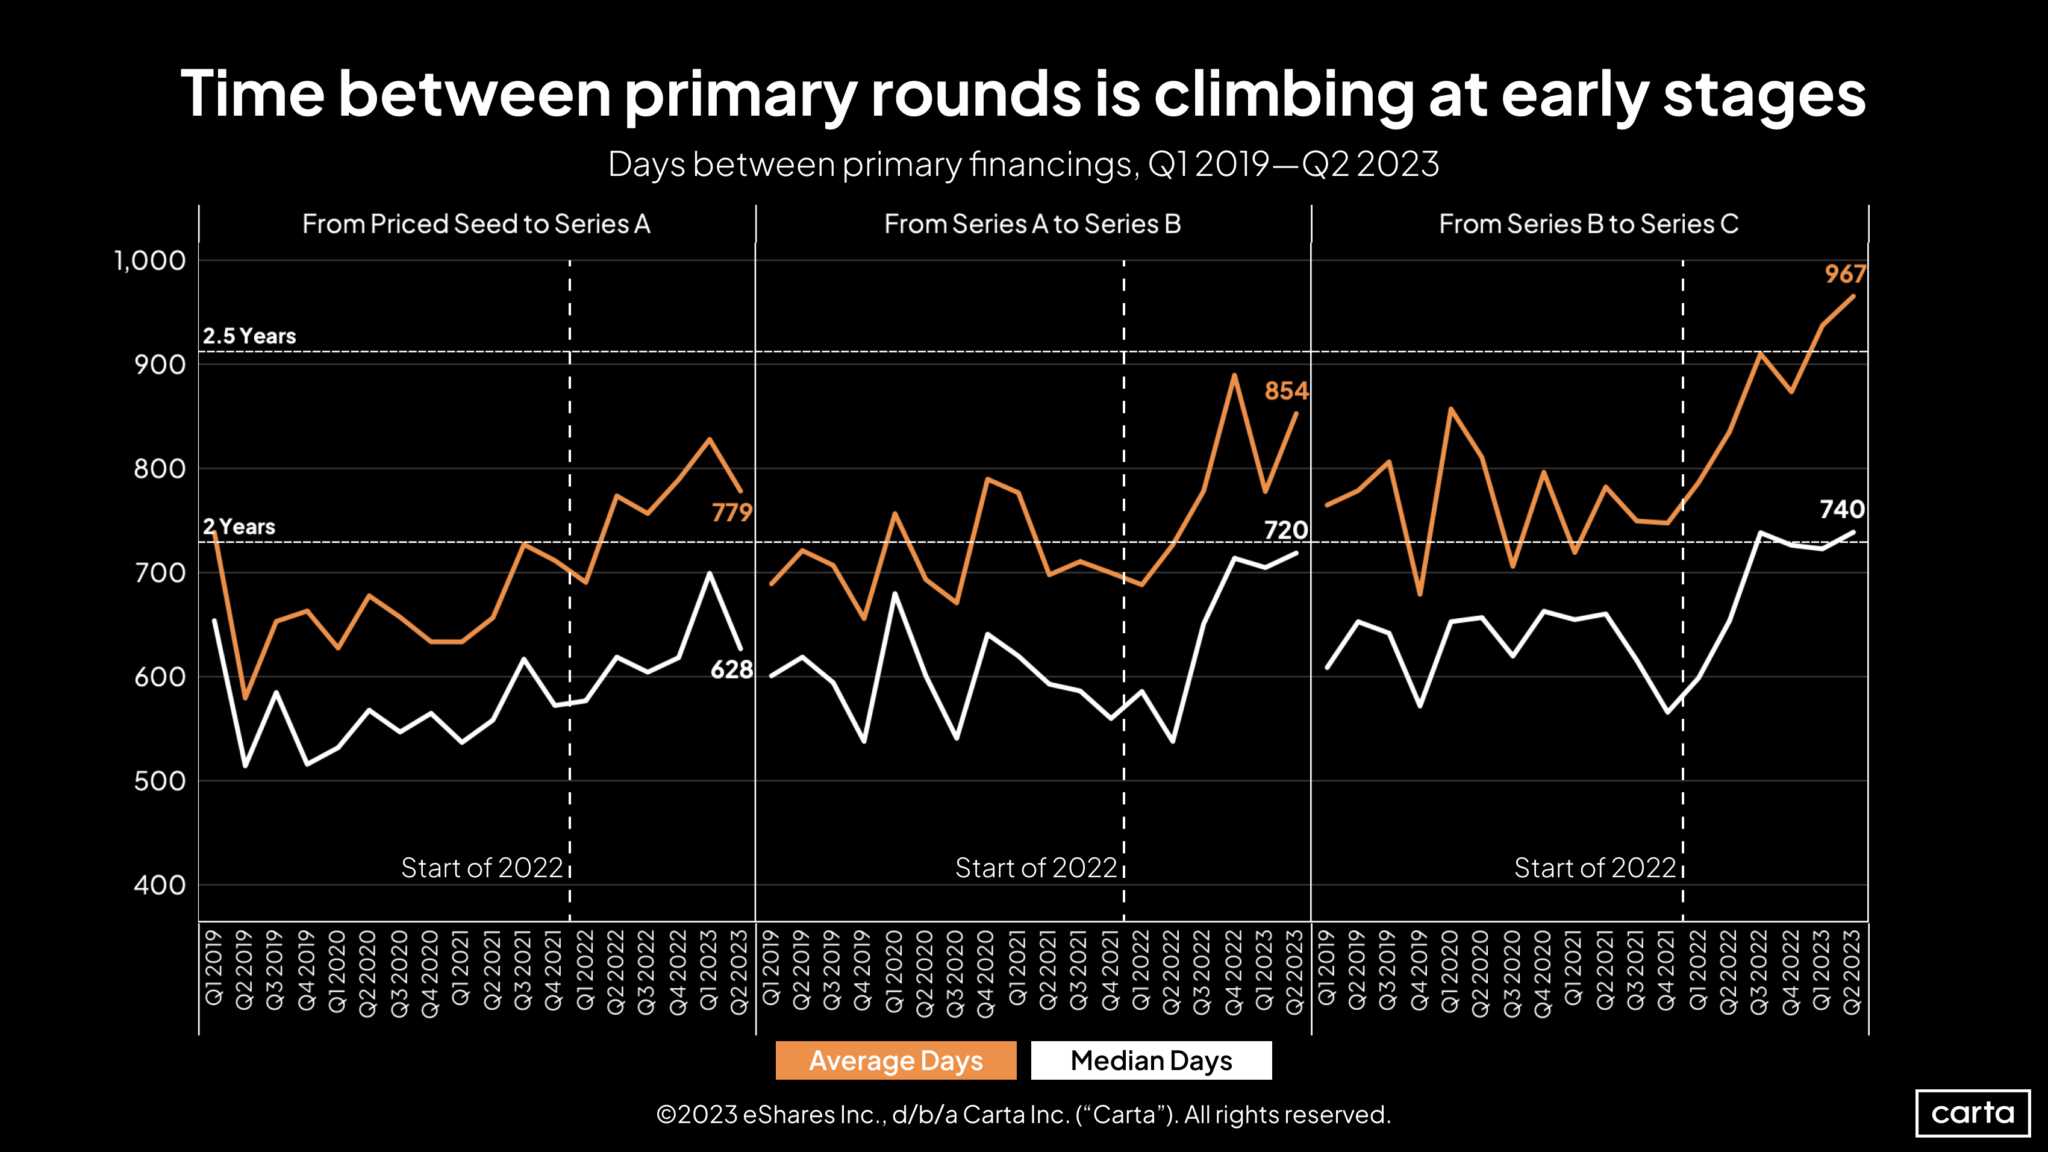
Timing Between Financings (Q1 2019 – Q2 2023)
- Average wait from Series B to Series C was 967 days in Q2, an increase of nearly 200 days compared to 2021.
- Time from seed to Series A shortened by 50 days QoQ.
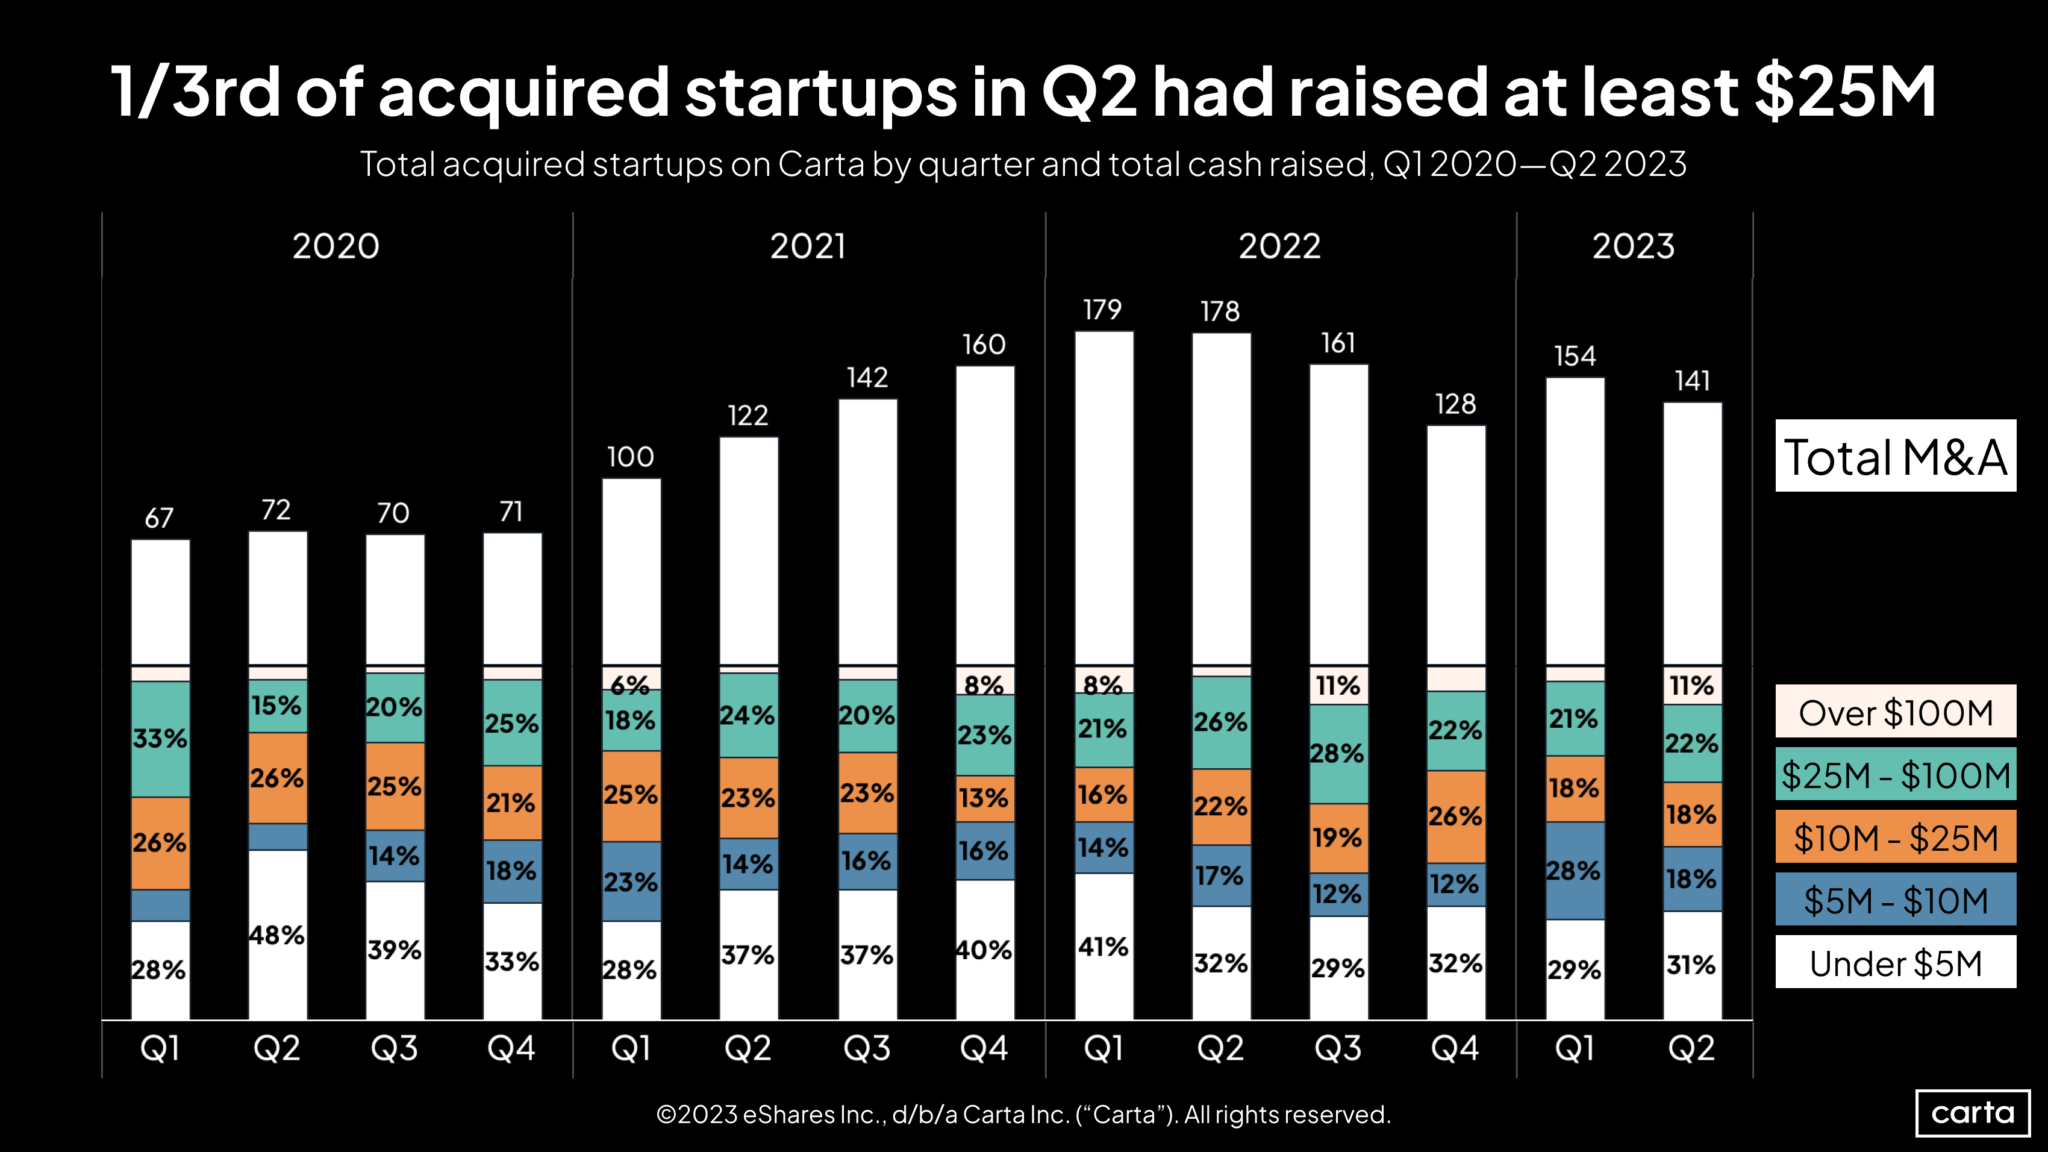
Startup Acquisitions (Q1 2019 – Q2 2023)
- 11% of acquired startups in Q2 had raised over $100 million.
- Transactions fell to 141, an 8% dip, yet the market remains resilient.
Employee Equity & Movement (Q1 2018 – Q2 2023)
Vested Options Exercise
- Declined for six straight quarters, tied for the lowest rate in five years at 26% in Q2.

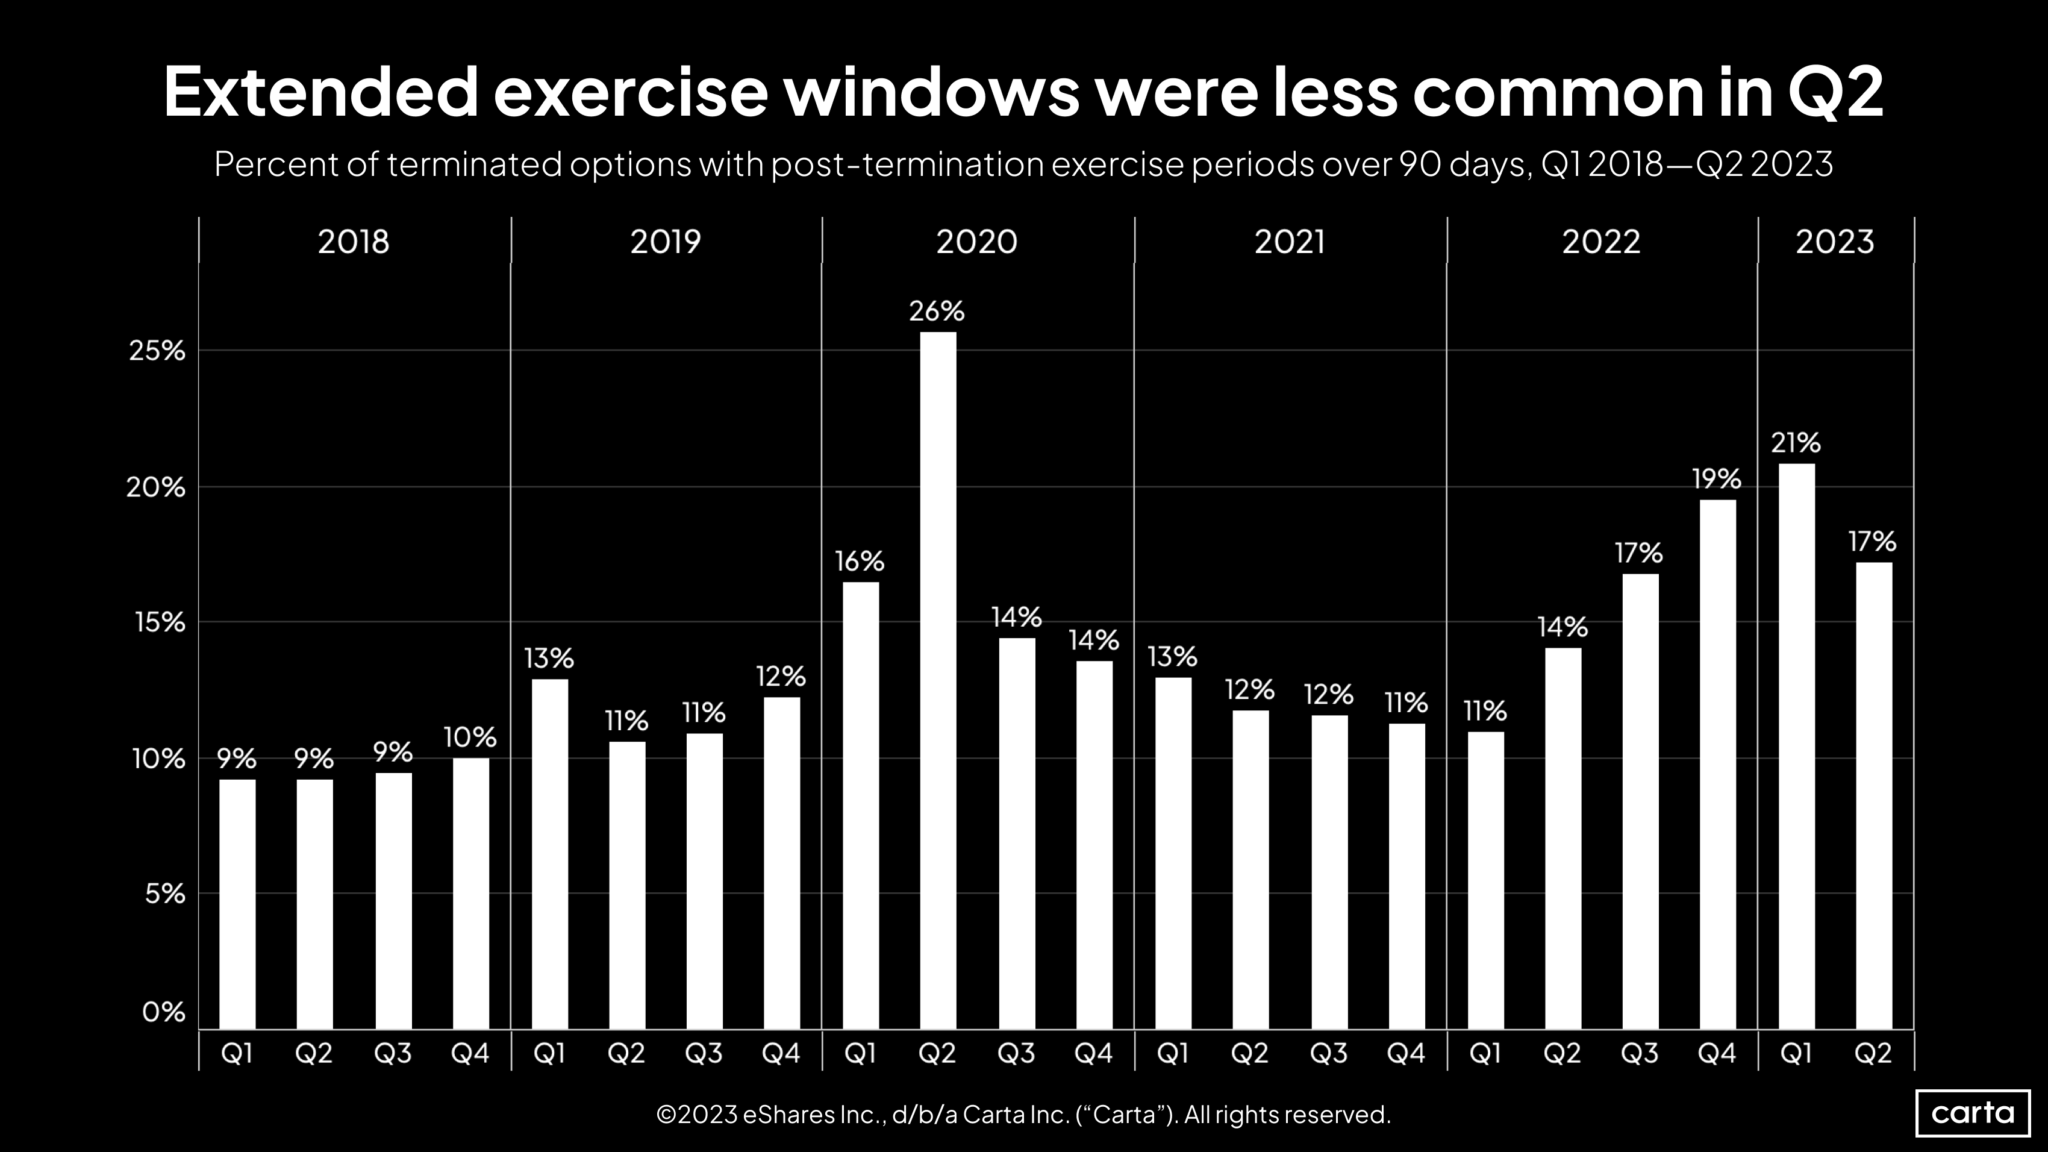
Post-Termination Exercise Periods (PTEP)
- Less likely in Q2, correlating with a decline in layoffs.
Option Grant Repricings
- Fell by 25% QoQ, but remains high relative to past years.
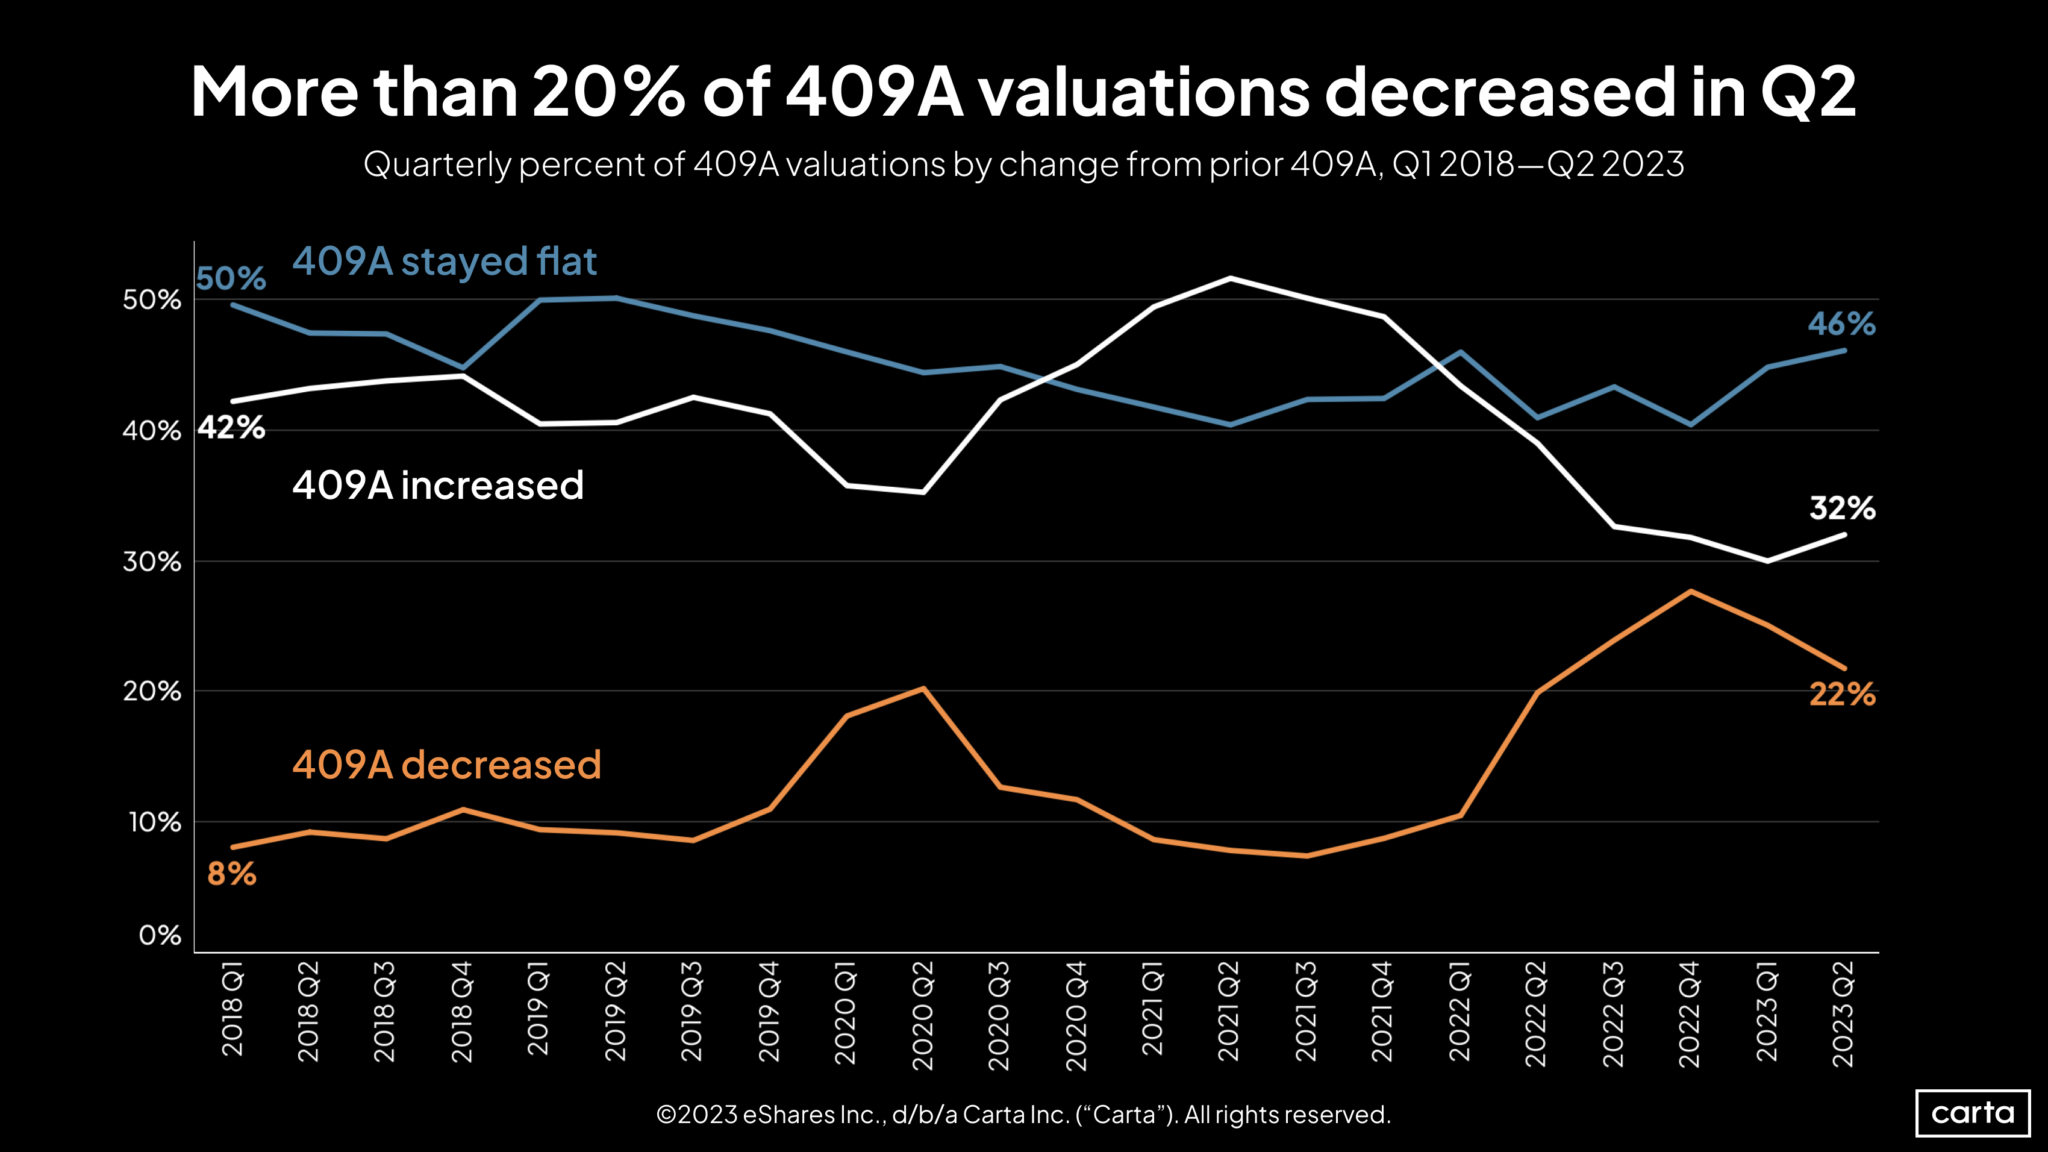
409A Valuations
- 32% were higher in Q2, first increase in two years.
Employee Departures (Jan 2019 – Jun 2023)
- Layoffs fell below 10,000 for two consecutive months but remain high historically.
- Voluntary departures aligned with historical norms, outnumbering layoffs from March to June.
This restructured version of the data organizes the information into more digestible sections and highlights the key takeaways.